
Introduction:
RadControls for ASP.NET AJAX contains a HTML5 powered charting control known as RadHtmlChart. This charting component outputs SVG and is completely client side rendering of the chart. The charting component will output SVG on modern browsers and falls back to VML when running in older browsers. When it comes to data binding the chart, it supports a wide range of data binding mechanism starting from simple array to your custom object collection. In this blog post we will take a look at one of the data binding mechanism namely binding to SqlDataSource.
Pre-Requisites:
In order to follow this post, you will need our RadControls for ASP.NET AJAX suite. You can download a 30 day free trial from http://www.telerik.com/products/aspnet-ajax.aspx. So download the trial and install it on your system. If you already have a licensed version installed that’s even better. Following sections assume that you have done this.
Getting Started:
First lets create a “C# RadControls Web Application”. Fire up a Visual Studio and do the customary File > New Project action. In the new project dialog, you will see Telerik as one of the installed template. Expand Telerik and you will see Web as one of the nodes. Select Web and you will presented with different project templates. Select “C# RadControls Web Application”. Give your project a name and click Ok.
 Fig 1: New Project Dialog
You will be presented with 2 more dialogs to select theme and web settings. Select appropriately and finish the wizard. Visual Studio will go ahead and create the project.
Adding SQL Data Source to the page:
The project template will add all references required for Telerik ASP.NET Ajax controls, necessary updates to Web.config and create a Default.aspx page. We will be working with Default.aspx for this blog post. Since we need to bind the chart to a SqlDataSource control, lets go ahead and add one to the page. You can configure the data source using the smart tag option in the ASPX page or just go to design and select the smart tag on the control.

Fig 2: Configuring SqlDataSource
Clicking on Configure Data Source, will open “Choose Your Data Connection” dialog. So go ahead and set up your connection for the data source. For this example I will be using Northwind as the database and Products table. Once you pass the connection settings dialog, you will be required to configure the select statement. For this demo I will just do a select of top 10 products by their price in descending order. Here is how my test query looks like:
 Fig 3: Test Query Dialog
Click Finish to finish configuring the SqlDataSource. Next we will see how to work with RadHtmlChart.
Adding RadHtmlChart to the page:
From the Toolbox, drag and drop a RadHtmlChart on the page. In the ASPX page, select the smart tag on the RadHtmlChart. It will open a configuration window. We will configure the RadHtmlChart now to work with SqlDataSource control.

Fig 4: RadHtmlChart Smart Tasks
Select the DataSource from the Choose Data Source drop down.Then click on the Open Configuration Wizard. You will see the following Configuration Wizard pop up:
 Fig 5: RadHtmlChart Configuration Wizard
We will go through the configuration one by one.
Chart Type:
For this blog post I will be going with Column chart. So in the Type tab, select Column Chart.
 Fig 6: Chart Type selection
Data:
Now to let the chart know where to read the data from, select the Data tab. The data source would have been defaulted to the sql data source we had added in previous section. Now we need to add a series to the chart. Click on the “+” button next to the Series section. Provide Name, AxisName, Type of the series and what field in the data source should the Y axis data point be read from. For this example UnitPrice will be my Y axis data point. I will be plotting the price on the Y axis. Here is how my settings look like:

Fig 7: Series configuration
X Axis:
Now we need to configure how our X axis will look like. If you want to customize the Min Value, Max Value, Step and Axis Crossing Value or you want to hard code the X axis items, you can do so in the XAxis tab.

Fig 8: XAxis Configuration
Once done with the settings click Apply. Now we need to show the product name as the X axis data point. For that we will need to get back to the code, add a property called “DataLabelsField” and value of this property will be the column name from the data source which will contain the data points. In our case this will be ProductName column. Here is the code:
<XAxis DataLabelsField="ProductName"></XAxis>
Y Axis:
Similar to XAxis you can customize how you want the YAxis to look. The YAxis tab provides you options to customize the axis and also allows you to add additional Y Axis to the chart.

Fig 9: YAxis Configuration
In our current example, we don’t have to do anything here. The Min and Max value and Step will be calculated automatically based on the data source.
Legend, Title:
Last but not the least, we can customize how the Legend and the Title of chart should look like. Click on the Legend/Title tab and provide the appropriate data. Here is my settings:

Fig 10: Legend, Title Configuration
Click Ok when done. This will generate the following code in the ASPX:
<telerik:RadHtmlChart ID="RadHtmlChart1"
runat="server" DataSourceID="SqlDataSource1">
 <ChartTitle Text="Top 10 Products By Price">
 <Appearance>
 <TextStyle FontSize="16px"></TextStyle>
 </Appearance>
 </ChartTitle>
 <Legend>
 <Appearance Position="Top"></Appearance>
 </Legend>
 <PlotArea>
 <XAxis DataLabelsField="ProductName">
 </XAxis>
 <YAxis Name="Price">
 </YAxis>
 <Series>
 <telerik:ColumnSeries Name="Price"
 DataFieldY="UnitPrice" />
 </Series>
 </PlotArea>
 </telerik:RadHtmlChart>
So we are now done with the RadHtmlChart configuration. We have configured it to work with the Sql Data Source we added in the previous section. We have set what chart we want and configured the series, XAxis, YAxis and Legend/Title. Its time now to look at the output.
Output:
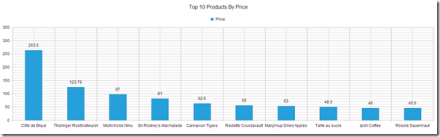
Build and run the project. It should open up a browser and show you the following chart output:

Fig 11: RadHtmlChart output
Conclusion:
In this post we saw how easy it is to configure RadHtmlChart to work with Sql Data Source. Also we looked at the RadHtmlChart configuration wizard which makes it super easy to configure the chart with various settings and best of all you don’t have to write any code. The configuration wizard gives you a GUI and when you are done with the settings, it will generate the code for you. I say this is a productivity gainer. Let us know how you are using RadHtmlChart in your projects. We will love to hear your feedback or suggestions. So do drop in a line in the comments.
Till next time, Happy Coding.
