Introduction:
This is the 3rd blog post in the series on RadHtmlChart, our HTML5 based charting control for ASP.NET AJAX and its data binding options. So far we have seen data binding the RadHtmlChart control with SQLDataSource and LinqDataSource. In this blog post we will look at one more data binding option namely binding to EntityDataSource.
In this blog post we will focus on how to create a EDM or entity Data Model using Entity Framework, then adding the EntityDataSource control to the web page and finally binding it to the RadHtmlChart. For the rest of this post it is assumed that you have already installed our RadControls for ASP.NET AJAX suite and also our free ORM called OpenAccess.
About EntityDataSource:
EntityDataSource is a control that was made available during the days of Visual Studio 2008 SP1 i.e. .NET 3.5. According to MSDN EntityDataSource control is defines as:
A control which can be used together with a data-bound control to retrieve data from an EDM and to display, edit, and sort data on a Web page by using little or no code.
I wont be spending too much time on discussing EntityDataSource control in this blog post. I suggest you to go through the overview article from MSDN available here: http://msdn.microsoft.com/en-us/library/cc488502.aspx. The article will get you up to speed with the EntityDataSource control.
Getting Started:
To start with, lets create a “C# RadControls Web Application”. Open a Visual Studio and navigate to File > New Project > Telerik > Web and select “C# RadControls Web Application”. Give it a name & click finish so that VS can go ahead and create the project for us.

Figure 1: New Project Dialog
Adding ADO.NET Entity Data Model:
Entity Data Source control requires a ADO.NET Entity Data Model to work with. Entity Data Source can be configured to work with a Entity Data Context for reading, creating, updating and deleting data with little or no code from the web page. In order to create a EDM, we need to first add Entity Framework bits to our project. Use the Nuget Package Manager to add a package named EntityFramework.

Figure 2: Nuget Package Manager
One of the best practice is to create a Models folder at the root of the web application. So lets create a folder called Models. Right click on the Models folder and select Add > New Item. In the new item dialog, under Data category select “ADO.NET Entity Data Model”, give it a name and click Add.

Figure 3: Add New Item Dialog
Next we will be presented with a EDM Wizard. In the interest of the time, I will post my settings in the wizard as a serious of images below:

Figure 4: Entity Data Model Contents

Figure 5: Data Connection

Figure 6: Database objects
Once we finish with the wizard, NorthwindEntityDataModel.edmx is created in the Models folder. Double clicking that we will be presented with a visual designer with one object called Product placed. Remember we had selected only one Table for this demo called Product. Here is the screen shot of the EDMX designer:

Figure 7: EDMX Designer
Now that we have the EDM created, next is to add the Entity Data Source control to the page.
Adding Entity Data Source Control:
Open Default.aspx page and add EntityDataSource control to the page. You can either drag and drop the entity data source control from toolbar and you can write the declarative code by hand. I will drag and drop it from the toolbox onto the page. Use the Entity Data Source control smart tag (either from the ASPX page or from the designer) to configure data source settings. Here is my settings for the data source:

Figure 8: Object Context Configuration

Fig 9: Data Selection Configuration
When we finish the configuration wizard, following code will be generated by the Visual Studio
<asp:entitydatasource id="NorthwindEntityDataSource" runat="server"
defaultcontainername="NORTHWINDEntities" connectionstring="name=NORTHWINDEntities"
enableflattening="False" entitysetname="Products"
entitytypefilter="Product"
select="it.[ProductName], it.[UnitPrice]">
</asp:entitydatasource>
Note that we couldn’t add the top 10 keywords when configuring using the wizard and also there was no way to provide the orderby clause. In order to specify the top keyword just prepend “top(10)” to the Select text. EntityDataSource supports OrderBy property. So add the property and provide the value “it.UnitPrice DESC”. Here is the final code:
<asp:EntityDataSource ID="NorthwindEntityDataSource" runat="server"
                DefaultContainerName="NORTHWINDEntities"
                ConnectionString="name=NORTHWINDEntities"
                EnableFlattening="False"
                EntitySetName="Products"
                EntityTypeFilter="Product"
                Select="top(10) it.[ProductName], it.[UnitPrice]"
                OrderBy="it.UnitPrice DESC" >
            </asp:EntityDataSource>
Add RadHtmlChart:
You can add a RadHtmlChart either by dragging and dropping from the toolbox onto the page or by writing the declarative code on the page. I will be dragging and dropping the control on to the page. Following 3 things need to be taken care while data binding to a EntityDataSource. They are:
-
DataSourceID: Set the DataSourceID property of the RadHtmlChart to the name of the Entity Data Source you want to bind to.
-
DataFieldY: Set the DataFieldY property of the data series to the column name from which the data points have to plotted on the Y axis. I am plotting the UnitPrice on the Y axis so I will set the DataFieldY property to “UnitPrice”
-
DataLabelsfield: Set the DataFieldsLabel property of the XAxis to the column name from which we need the X axis data points to be plotted. I am having the products name on the XAxis so I will set the DataLabelsField property to “ProductName”.
Here is the complete code for the RadHtmlChart:
<telerik:RadHtmlChart ID="RadHtmlChart1" runat="server"
DataSourceID="NorthwindEntityDataSource"
Height="600px" Width="1000px">
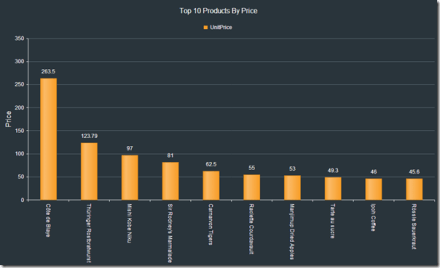
<ChartTitle Text="Top 10 Products By Price">
<Appearance>
<TextStyle FontSize="16px"></TextStyle>
</Appearance>
</ChartTitle>
<Legend>
<Appearance Position="Top">
</Appearance>
</Legend>
<PlotArea>
<Series>
<telerik:ColumnSeries Name="UnitPrice" DataFieldY="UnitPrice">
</telerik:ColumnSeries>
</Series>
<XAxis DataLabelsField="ProductName">
<LabelsAppearance RotationAngle="90" />
<MinorGridLines Visible="false" />
<MajorGridLines Visible="false" />
</XAxis>
<YAxis>
<TitleAppearance Text="Price" />
<MinorGridLines Visible="false" />
</YAxis>
</PlotArea>
</telerik:RadHtmlChart>
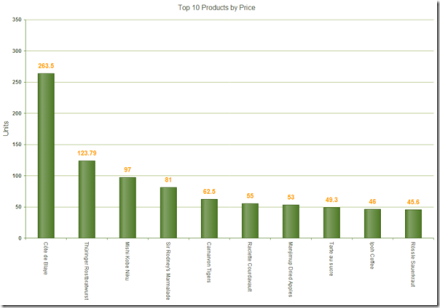
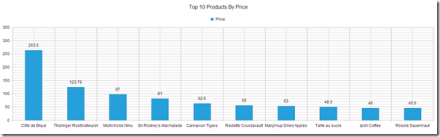
Here is the output of the chart:

Figure 10: RadHtmlChart Output
Summary:
In this post we looked at one more data binding technique with RadHtmlChart. We looked at EntityDataSource, how to configure entity data source and finally how to bind it with RadHtmlChart. With just 3 things to take care its very easy to bind the chart with entity data source. Hope this makes you excited to start working with RadHtmlChart. Do let us know your experience with the RadHtmlChart.
Till next time – Happy Coding !