
Introduction:
RadHtmlChart which is a charting component in RadControls for ASP.NET AJAX suite supports binding to variety of data sources. In this post we will look at a scenario where we will see how to bind the RadHtmlChart to LinqDataSource. So the rest of this post is about how to achieve databinding linq data source to RadHtmlChatrt. So lets get started. First we will look at creating a new project in Visual Studio, then we will add a Data Context to the project, then add a LinqDataSource & use the data context to return top 10 products from Northwind database and finally add RadHtmlChart and see how to use LinqDataSource as the source of the chart.
Creating New Project:
To get started, let’s first create a new “C# RadControls Web Application”. Note you need to have our RadControls for ASP.NET suite installed before you can do this. Open a Visual Studio, select File > New Project > Telerik > Web and C# RadControls Web Application.
 Figure 1: New Project Dialog
Visual Studio will go ahead and create a Web Application. It will have a single page named Default.aspx. For the rest of the demo, we will work with this page.
Add Northwind Data Context:
In order to work with Linq Data Source, I will create a Entity Data Context using our OpenAccess ORM. OpenAccess is a free tool to download and you can use this in your production too without any licensing involved. First Add New Item to your project of type “Telerik OpenAccess Domain Model”. Give it a name and click Ok.

Figure 2: Add New Item dialog
You will next be presented with a wizard. Here is the wizard dialog screen shots and the settings I have done:

Figure 3: OpenAccess Model Type

Figure 4: Database Connection

Figure 5: Database Items – Products Table Selected
 Figure 6: Naming Rules

Figure 7: Code Generation Settings
Once you click finish, the wizard will create a .rlinq file in your project. If you double click the rlinq file, you will get a visual designer. For this post I have selected only Products table. So you will see the products table visually laid out:

Figure 8: OpenAccess Data Model
Next we will see how to add a LinqDataSource and hook that with our data model to return the products data.
Add LinqDataSource:
In order to add LinqDataSource to your page, you can either drag and drop from the tool box or directly code the tag in the source file. What we will do for this demo is, we will handle a specific event called OnSelecting. In the event handler we will instantiate our OpenAccess data model and return the top 10 products ordered by UnitPrice in descending order. Here is the code which defines LinqDataSource control on the page:
<asp:LinqDataSource ID="LinqDataSource1"
        runat="server"
        OnSelecting="LinqDataSource1_Selecting">
    </asp:LinqDataSource>
Here is the event handler definition:
protected void LinqDataSource1_Selecting(object sender, LinqDataSourceSelectEventArgs e)
    {
        NorthwindDataModel context = new NorthwindDataModel();
        e.Result = context.Products
                          .OrderByDescending(p => p.UnitPrice)
                          .Take(10);
    }
Now that we have the data model and the linq data source only thing left out is to add the RadHtmlChart and bind it to linq data source.
Add RadHtmlChart:
So now we are ready to add the chart. You can either drag & drop the chart from the toolbox on to the page or code the chart definition directly on the page. In this post I will just add the RadHtmlChart code and highlight the main points you need to take care while wiring it with LinqDataSource.
So here is my chart definition:
<telerik:RadHtmlChart runat="server" ID="RadHtmlChart1"
                DataSourceID="LinqDataSource1" Width="1000" Height="700">
                <PlotArea>
                    <Series>
                        <telerik:ColumnSeries DataFieldY="UnitPrice" Name="Price">
                            <LabelsAppearance>
                                <TextStyle Bold="true" FontSize="15" Color="Orange" />
                            </LabelsAppearance>
                            <TooltipsAppearance Visible="false" />
                        </telerik:ColumnSeries>
                    </Series>
                    <XAxis DataLabelsField="ProductName">
                        <LabelsAppearance RotationAngle="90" />
                        <MajorGridLines Visible="false" />
                        <MinorGridLines Visible="false" />
                    </XAxis>
                    <YAxis>
                        <LabelsAppearance><TextStyle Bold="true" /></LabelsAppearance>
                        <TitleAppearance Text="Units" />
                        <MinorGridLines Visible="false" />
                    </YAxis>
                </PlotArea>
                <Legend>
                    <Appearance Visible="false" />
                </Legend>
                <ChartTitle Text="Top 10 Products by Price">
                </ChartTitle>
            </telerik:RadHtmlChart>
Here are the things you need to do for wiring up the chart with LinqDataSource:
- On the chart set the DataSourceID property to the ID of the LinqDataSource
- When you define a series, set the DataFieldY property to a value “UnitPrice”. Here UnitPrice is the column in my data source which I want to bind and plot the points on Y axis
- On the XAxis definition, set the DataLabelsField property to a value “ProductName”. Here ProductName is the column to which I want to bind and plot the XAxis points.
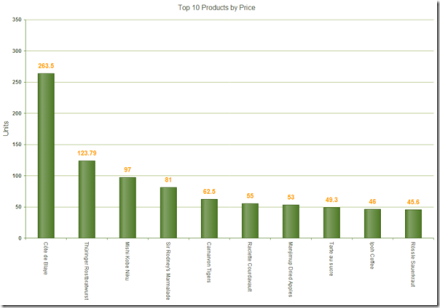
And that’s all its there to wiring up the RadHtmlChart to LinqDataSource. Now build the project and run to see the output. Here is a screenshot of the chart we just created:

Figure 9: RadHtmlChart output
Summary:
In this blog post I wanted to show one of the data binding option that RadHtmlChart supports – namely LinqDataSource. As we have seen it is very easy to create a LinqDataSource and bind it to RadHtmlChart. We just need to take care of 3 things to make the chart work with the LinqDataSource. I hope this blog post gives you a head start if you are working with LinqDataSource and the RadHtmlChart. Do let us know your feedback/comment you may have on this post.
Till next time – Happy Coding.

Hi,
RadHtmlChart (Pie) slice colors are getting repeated if the pie chart list has more than 5 records. How to get distinct/unique colors for which data is binding through list.
Thanks for your support.
Regards,
Lavanya