In this blog post i will take a look at one of the simplest API configuration we have for Kendo UI Data Visualization. When you use Kendo UI Data Viz to plot a chart have you ever wanted to provide your own custom colors for the series in the chart. If yes, well read on – i will show you how to achieve custom colors on series using Kendo UI Data Viz. Lets get started. Continue reading →
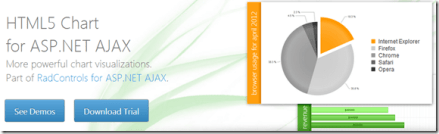
Almost 4 years ago just when i started working for Telerik or now Progress Software, i had written a blog post titled “Step by Step Guide to work with RadHtmlChart for ASP.NET AJAX”. The idea behind that blog post was to give you a step by step instruction on how to use the HTML5 Chart controls in our UI for ASP.NET AJAX suite. Couple of days ago i had a comment on that blog post where the user asked me “How to create the same chart from code behind i.e.entirely through code”. A common scenario if you ask me. So i thought of doing a step by step instruction on how to create HTML5 chart entirely through code and this blog post will outline that. Continue reading →
On Oct 20 2016 we finished yet another Webinar. These webinars are usually held between 12PM to 1PM IST on 2/3/4 Thursdays of every month. This webinar we talked about “Graphs/Charts for Cross Platform Native Mobile Applications using NativeScript”. Continue reading →
As part of evangelism job I speak to a lot of customer and try to tell them how they can use our controls. Couple of days back I was speaking one customer who was evaluating our RadControls for Silverlight suite and in particular was working with RadCartesianChart control. He saw all our demos of RadCartesianChart we ship and said that they all provide data from the code behind and are static in nature. They were looking for examples which tell them how to consume data from a WCF service and provide it to RadCartesianChart. So this blog post is all about how do we provide data to ChartView from a WCF Service. So lets get started.
Create RadControls Silverlight Application:
First thing to do, is to create a new project of type RadControls Silverlight Application. I am using Visual Studio 2012 for the rest of this blog post. You can do this in VS2010 too. Open Visual Studio IDE and select File > New Project. In the New Project dialog select Telerik > Silverlight > C# RadControls Silverlight Application. Give a name for the project and click ok.
Fig 1. New Project Dialog
Next, Visual Studio will ask you whether to host the SL app in a new web site and what should be the SL version. I am opting SL Version 5 for the sake of the demo. Here is the screenshot of the dialog:
Fig 2. Silverlight Application Settings Dialog
Since we have selected RadControls Silverlight Application, next you will get a “Project Configuration Wizard” where you will select the Components you require in your project. Since I am only interested in Charting, I will select only Telerik.Windows.Controls.Charting and the wizard automatically selects the dependent components for me. Here is the screenshot of the dialog:
Clicking next will take you to theme settings. I am selecting Windows8 theme that comes out of the box. Click finish to let Visual Studio create the project.
Once Visual Studio finishes creating the project, here is how the solution will look like:
Fig 5: Solution Explorer
You can see that we have 2 projects in the solution. One is the actual Silverlight app and another is the Web app which will host the Silverlight XAP. Next we look at how to create a WCF service.
Create WCF Service:
For the sake of the demo, I will be creating a WCF service which does the following things:
Create a ProductModel which will act as a DataContract. It will have ProductID, Name and Price as properties
Create a WCF Service which will connect to Northwind Database.
Have one Operation called GetTop10ProductsByPrice. This will execute a simple query to fetch top 10 products price wise and convert that into list of ProductModel and return it to client
Product Model Class:
We will create the WCF service in Web App project. We App will host our service too. Create a new folder called “Model” and create the ProductModel class. Here is the code for the ProductModel class:
[DataContract]
public class ProductModel
{
private int productID;
[DataMember]
public int ProductID
{
get { return productID; }
set { productID = value; }
}

private string productName;
[DataMember]
public string ProductName
{
get { return productName; }
set { productName = value; }
}

private decimal price;
[DataMember]
public decimal Price
{
get { return price; }
set { price = value; }
}
}
Chart Data WCF Service:
First create a folder and name it as Services. Right click on Services folder and select Add > New Item. In Add New Item dialog, select Silverlight from installed templates and then Silverlight-enabled WCF Service. Lets name the service as ChartDataService.svc. Click Add to create the service.
Fig 6: Add New Item dialog
Next, since we need to connect to Northwind database, add a connection string to Web.config in the Web project. I have named my connection string as “NorthwindConnection”.
Next, in the ChartDataService, remove the generated operation contact with name “DoWork”. Instead add a new Operation and lets call it “GetTop10ProductsByPrice”. In this function we will connect to Northwind Database using SQL Connection and execute a simple query. We will loop through the data reader and generate a list of ProductModel and return the list. Here is the code for GetTop10ProductsByPrice operation:
[OperationContract]
        public IList GetTop10Products()
        {
            string nwConn = ConfigurationManager.ConnectionStrings["NorthwindConnection"].ConnectionString;
            var prodList = new List();
            using (SqlConnection conn = new SqlConnection(nwConn))
            {
                const string sql = @"SELECT TOP 10 ProductID, ProductName, UnitPrice
                                     FROM Products
                                     ORDER BY UnitPrice DESC";
                conn.Open();
                using (SqlCommand cmd = new SqlCommand(sql, conn))
                {
                    SqlDataReader dr = cmd.ExecuteReader(CommandBehavior.CloseConnection);
                    if (dr != null)
                        while (dr.Read())
                        {
                            var cust = new ProductModel
                            {
                                ProductID = dr.GetInt32(0),
                                ProductName = dr.GetString(1),
                                Price = dr.GetDecimal(2)
                            };
                            prodList.Add(cust);
                        }
                    return prodList;
                }
            }
        }
Consuming WCF Service from Silverlight App:
Now that we have a service, next thing to do is to reference that service in our Silverlight application. Right click on Silverlight application and select “Add Service Reference”. In the Add Service Reference window, click on Discover button. The WCF Service we created in the previous section will be automatically discovered and will list down the operation it supports.
Fig 7: Add Service Reference Dialog
Now click on the Advanced button located in the bottom left side of the dialog to open the service reference settings dialog. In the Service Reference Settings dialog, under Reuse types in referenced assemblies, select the System related assemblies and not the Telerik ones. Here is a screenshot of the dialog:
Fig 8: Service Reference Settings Dialog
Clicking Ok will add a service reference in Silverlight app which can be invoked at runtime to fetch the data required for the chart.
Add RadCartesianChart Control:
Next we need to add the ChartView control on the screen. In order to do this, Open MainPage.xaml, identify the ChartView control from the toolbox, drag and drop it on to the MainPage.XAML. Give the chart a name. Here is the code to CartesianChart markup:
Lets take a closer look at the code. I first define the vertical axis and tell the chart that it’s a linear axis. I also set title to the vertical axis and call it “Price (USD)” because my vertical axis will hold the price of products. Next, I define horizontal axis and and tell the chart that it’s a Categorical axis. My horizontal axis will be used to represent the product itself, so setting the title of horizontal axis as “Products”. Now that we have finished setting the axis only thing left now is to create a series. So I define Series and create a BarSeries. I have given a name for the bar series and will use this name in code behind to perform data binding. We need to provide the data to the series – so lets set the ItemsSource to the Binding it will get at runtime. Now we need to tell what fields corresponds to the value of the series and what corresponds to the category axis of the series. Set ValueBinding to “Price” field and CategoryBining to “ProductName”.
Data Binding:
We defined the UI part of the chart. Now to provide data to the chart. We had add a service reference to our WCF service earlier. So we will have a client class created in the Silverlight project and will be known as ChartServiceClient. So we will use this client class to invoke the “GetTop10Products” operation. Here is the code to invoke the service and bind the data received to the chart view:
void MainPage_Loaded(object sender, RoutedEventArgs e)
{
            ChartServiceClient client = new ChartServiceClient();
            client.GetTop10ProductsCompleted += client_GetTop10ProductsCompleted;
            client.GetTop10ProductsAsync();
}

void client_GetTop10ProductsCompleted(object sender, GetTop10ProductsCompletedEventArgs e)
{
            var data = e.Result;
            this.chartView.DataContext = data;
}
As you can see we invoke the operation asynchronously. When the operation completes we get the data and set it as the DataContext of the Chart. Run the application and when the page loads we should get the Chart as below:
As you can see we get our bar series graph which will show the price (in USD) on the vertical axis and products in the horizontal axis. We see the top 10 products by price.
Conclusion:
In this blog post, what I attempted was a very specific scenario which is most common on real world. As I said in the beginning, the customer I was talking to wanted to see an example of how to connect to a WCF Service, get data from the service and bind that data to Chart. So this blog posts outlines the steps required to make the chart work with WCF Service, Hope this is useful to many of you who may be having the same scenario. Do let me know your feedback if any.
In this post we will try to see how to work with a RadHtmlChart. We will go step by step in creating and using the RadHtmlChart in a web page. I will try to outline each piece that make up an RadHtmlChart and how to work with them. So if you are in need of using a RadHtmlChart in your pages, read through the following sections and follow along.
Pre-Requisite:
In order to follow along this blog post, you will need to have downloaded the RadControls for ASP.NET AJAX suite and installed it on your development machine/laptop. Here is the download link to RadControls for ASP.NET AJAX Suite:
Create a Web Site Project:
First and foremost thing to do is to create a Web Site which will be our playground for this blog post. Once you install the RadControls for ASP.NET AJAX you will see Telerik project templates in Visual Studio New Project dialog. For this blog post I will be creating a “C# RadControls Web Site” project. Give it a name and keep the default settings in all of the dialog that comes up.
Adding RadHtmlChart to a page:
The RadControls Web Site project template when finishes the web site creation, will create a single web page namely Default.aspx. For the sake of simplicity I will just use this page to create the chart. There are two ways to add the chart on to the web page. First, you can drag it from the Toolbox on to the source. Secondly you can just type the tag on the source.
So I am going to type out the tag name and create the chart. Here is the code to instantiate the RadHtmlChart on a web page:
We can instantiate the RadHtmlChart from the telerik namespace. If you look at the web.config the telerik tagprefix is configured to be available on all the pages. Here is the code snippet:
So if you now view the web page, you will see the following output:
As you can see from the output, we get the a base for the chart. Now that we have a base, we will build up the chart one by one.
Chart Appearance:
Now that we have a chart coming up, lets give some facelift to the chart. We can control the appearance of the chart i.e. we can provide a background color to the chart. The RadHtmlChart provides Appearance property through which we can set the background color. The Appearance contains FillStyle property which exposes BackgroundColor attribute and we set the color to this attribute. Here is the code snippet:
I have set LightGray as the background color of the chart. If we now run the application and check the output, you will see the chart as below:
Chart Title:
Next thing to do is to set the chart title. For setting the title, chart exposes ChartTitle property. ChartTitle contains a text Property and you can provide the text you want to see on the chart. The appearance of the chart title can be configured through Appearance property of the chart title. Here is the code snippet:
<ChartTitle Text="Server CPU Load By Days">
    <Appearance Align="Center" BackgroundColor="White" Position="Top" />
</ChartTitle>
Here is the snapshot of the chart after setting the title:
As you can see we have set the text and appearance of the title. Next we will take care of the legend.
Legend Appearance Settings:
Legend is nothing but a way to let the end user know what series belong to what context. So the way to style a legend is through Appearance property of Legend object. The appearance allows us to set the background color and position of the legend. Here is the code snippet for the same:
After adding the legend tag we cant see its effect immediately on the chart. That is because this comes into effect only when we provide the Y Axis items i.e. the main data points of the chart.
Plotarea Settings:
The plot area as the name goes is the area where the chart actually gets plotted. So We have the following options to play with respect to the play area:
Plotarea Appearance Settings
Plotarea X Axis Settings
Plotarea Y Axis Settings
Plotarea Series Settings
Lets look at the above points one by one.
Plotarea Appearance Settings:
The appearance of the plot area can be changed with Appearance property. Appearance property supports FillStyle child property where we can set the background color of the plot area. Here is the code snippet for the same:
So far we have just prepared the chart area and the plot area. We haven’t yet defined any axis related information on the chart. The X Axis settings are set as a child element of Plotarea object. Let me show you the code snippet of the same and explain the different attributes that make up the X Axis setting. Here is the code snippet:
On the XAxis we can first set the Color of the X Axis line. I have set it to Black; this can be of any color. Then MajorTickType is the type of the ticks that mark the major grid lines and values can be None of Outside. Similarly MinorTickType is the type of the ticks that mark the minor grid lines and this can be either None or Outside. Reversed is a setting which is used to determine if the axis will be reversed i.e. low value in place of high value and vice versa. I have set it to false. Next I have given the items that make up the x axis. The Items collection takes a AxisItem object which conatins an attribute named Labeltext. So in my example I am setting the x axis to week day names.
Also notice that we have ability to configure the LabelsAppearance i.e. the x axis labels appearance. You can format the label text and also rotate the label using the RotationAngle attribute. The MajorGridLines allows us to configure the color and width of the major grid line and similarly the MinorGridLines property. We can also provide a title to the x axis and is done so by setting the TitleAppearance property. You can position the title through Position attribute or rotate the title using the RotationAngle and also the title text through Text attribute. In my example I have given the text as Days. Here is the output of the above code configuration:
Plotarea Y Axis Settings:
Similar to X axis setting the Y axis also can be configured and pretty much the same attribute structure is used. Here is the Y Axis setting I have done for my example. Take a look at the code snippet and I will explain the code in a moment:
First, the Y axis setting is done on YAxis object of the RadHtmlChart. Pretty similar to X axis, we have the Color attribute of the Y axis line which can be configured. Then we set the MajorTickSize and MajorTickType. Similarly the MinorTickSize and MinorTickType is also set. The Min and Max value to be represented on the the Y Axis is set. We also can tell the increments in which the ticks have to be drawn through the Step attribute.
We can configure the Y axis labels through LabelsAppearance property. The MajorGridLines and MinorGridLines properties let us configure the color and width of the grid lines. The title of the Y axis is set through TitleAppearance property. Here is the output of the chart with the settings done so far:
Plotarea Series Settings:
So far we have set up the X & Y axis and configured them with respect to the axis title, major and minor grid lines. The main heart of the chart is the Series collection that Plotarea contains. Series collection is the property on which we define what kind of chart series we would like to plot. It can be a BarSeries or ColumnSeries or LineSeries etc etc. In this example I will be considering a simple example of Bar chart so we will see how to define a BarSeries.
We will need to add BarSeries object to Series collection. The BarSeries can be given a name using attribute Name. Then the actual values of the data points can be added to Items collection of BarSeries. The type of item to add is SeriesItem and it contains a attribute named YValue which needs to be filled with the data value. This is the data point which will be plotted on the chart. We can customize the labels and the tool tip of the bar series. Here is the code snippet for the same:
with the above code here is how our chart looks like now:
Notice that the axis have been shifted automatically because the series we said to plot was a BarSeries and Bar is always plotted as a horizontal line. Also notice the appearance of the legend at the bottom. This is because as soon as we provided a series with a name, the name of the series becomes the legend text.
What if I want to add another series to the chart. Simple, just add another BarSeries to the Series collection and the chart will pick up the second series and plot it along with the first one. Here is the snapshot of the same chart after I added another series:
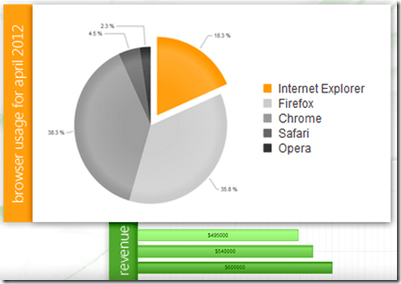
One of the cool features of RadHtmlChart is the fact that it will render the chart as a SVG on modern browsers and as a VML on older browser. So here is a screenshot of the same chart zoomed in at around 200%. Check out the clarity of the various chart details:
Here is the entire source code of the RadHtmlChart we have done so far:
This file contains hidden or bidirectional Unicode text that may be interpreted or compiled differently than what appears below. To review, open the file in an editor that reveals hidden Unicode characters.
Learn more about bidirectional Unicode characters
In this blog post I attempted to construct a RadHtmlChart piece by piece and show how easy it is to configure different aspects of the RadHtmlChart control. Things to take care are the Chart Appearance, Chart Title, Legend and Plotarea. Hope this gives you all a jump start in to working with the RadHtmlChart.
Note:
It is not necessary to hand code all of the above mentioned configuration settings. RadHtmlChart control has a rich visual designer support. Using that with couple of clicks you can easily set all the above talked configuration settings on a GUI. I will be writing a separate blog post on this.
The appearance of the chart and other aspects of the chart need not be set explicitly by choosing color which configuring rather RadHtmlChart ships with default 19 skins and you can just set the skin on the RadHtmlChart and that will take care of the color aspect in the chart. I will be covering this in a separate blog post.
The items for the series need not be hard coded as shown in this blog post. This was just an attempt to show that how things work. The RadHtmlChart supports 9 types of data sources and the chart can be bound to any of those data source. That way the items of the Y Axis will be bound at run time from the data source. I will be covering this in a future blog post
In previous blog post, we looked at the element structure that makes up a RadHtmlChart. Now that was more from a client side i.e. a visual structure of what makes the chart. In this blog post we will take a look at what makes up the RadHtmlChart API i.e. the server side hierarchy.
Server Side API:
Pretty much all the Telerik RadControls enable you to customize them according to your needs & wants and so does RadHtmlChart. RadHtmlChart allows you to perform detailed customizations when you use it. Being a Service Side control, it offers a large set of properties. A deep hierarchy exist among these properties and it is this hierarchy that makes it possible to organize the control.
Visual Hierarchy:
Below diagram depicts the visual hierarchy of properties that RadHtmlChart control supports. You can keep this diagram handy and keep it as a reference when you want to set a particular property in the markup.
When you want to customize something in the RadHtmlChart you should pay attention to the inner most tags and their properties. For e.g. in order to customize the Appearance of a RadHtmlChart – You will be customizing the Appearance property and specifically the FillStyle child property that Appearance contains.
Conclusion:
Knowing a controls hierarchy visually helps us to understand how it is organized. And also it becomes easy when we want to customize the control according to our needs and wants. Through this blog post I hope I was able to make you understand the RadHtmlChart control hierarchy.