

Almost 4 years ago just when i started working for Telerik or now Progress Software, i had written a blog post titled “Step by Step Guide to work with RadHtmlChart for ASP.NET AJAX”. The idea behind that blog post was to give you a step by step instruction on how to use the HTML5 Chart controls in our UI for ASP.NET AJAX suite. Couple of days ago i had a comment on that blog post where the user asked me “How to create the same chart from code behind i.e.entirely through code”. A common scenario if you ask me. So i thought of doing a step by step instruction on how to create HTML5 chart entirely through code and this blog post will outline that.
Pre-requisites:
You will need to have Telerik UI for ASP.NET AJAX suite installed on your machine. You can download a 30 day free trial from here. Rest of this blog post i assume you have our controls installed on your development environment.
Lets get rolling.
Create New Project:
First, lets create a C# Web Forms project. I am using Visual Studio 2015 ultimate in my development environment. Click File > New Project. Select Telerik > Web > Telerik C# Web Forms Site project template. Give it a name and click Ok. Visual Studio will spin up our new project and we are all set to code.
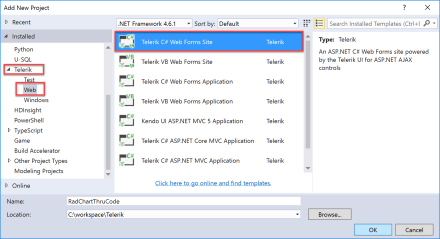
Fig 1. Add New Project
Add RadHtmlChart Control:
When you created the new project, as part of the template you will have Default.aspx created automatically. Lets add the RadHtmlChart control to our Default.aspx page now. You can either drag & drop from the toolbox or code it by hand (which i usually do). Here is the code snippet for RadHtmlChart control:
| <telerik:RadHtmlChart ID="myChart" runat="server"></telerik:RadHtmlChart> |
In the code behind of Default.aspx, have the following code in the Page_Load event handler:
| protected void Page_Load(object sender, EventArgs e) | |
| { | |
| if (!IsPostBack) | |
| { | |
| LoadChart(); | |
| } | |
| } |
I am just checking if this is the first load of the page or not and if it is the first load, i make a helper method to load the chart. Lets start looking how to go step by step in crafting the RadHtmlChart
Setting Chart Background Appearance:
First lets set the chart appearance. We will set the background color for the chart itself. Following is the code snippet which sets the chart appearance:
| myChart.Appearance.FillStyle.BackgroundColor = Color.LightGray; |
Chart has a Appearance property. Appearance provides FillStyle property and we use BackgroudColor property of FillStyle to set a color.
Set Up Chart Title:
Next up, lets set up the Chart title. Chart exposes ChartTitle property. We use thsi property to set the text and appearance i.e. Alignment, Color and Position of the title. Here is the code snippet to set the title:
| //set up chart title | |
| var chartTitle = myChart.ChartTitle; | |
| chartTitle.Text = "Server CPU Load by Days"; | |
| chartTitle.Appearance.Align = ChartTitleAlign.Center; | |
| chartTitle.Appearance.BackgroundColor = Color.White; | |
| chartTitle.Appearance.Position = ChartTitlePosition.Top; |
Set Up Chart Legend:
Now, lets set up the Chart legend. We make use of the Legend property of Chart and set the background color & position of the legend. Here is the code to do this:
| //set up chart legend | |
| var legend = myChart.Legend; | |
| legend.Appearance.BackgroundColor = Color.White; | |
| legend.Appearance.Position = ChartLegendPosition.Bottom; |
Set Up Plot Area:
PlotArea is where the chart draws the X Axis, Y Axis and the axis grid lines. We can customize the plot area such as appearance etc. Here is a code snippet to set the background color of the plot area to yellow green:
| //set up plot area | |
| var plotArea = myChart.PlotArea; | |
| plotArea.Appearance.FillStyle.BackgroundColor = Color.YellowGreen; |
Set Up X Axis:
Now the real thing. We will need to set the X Axis of the Chart. We can get hold of XAxis property of the chart to do the customization. We can set things like Major/Minor tick types, Items for X Axis, Label/Title appearance etc. Here is a code snippet of how to set chart X Axis:
| //set up x-axis | |
| var xAxis = plotArea.XAxis; | |
| xAxis.AxisCrossingValue = 0; | |
| xAxis.Color = Color.Black; | |
| xAxis.MajorTickType = TickType.Outside; | |
| xAxis.MinorTickType = TickType.None; | |
| xAxis.Reversed = false; | |
| var axisItemCollection = xAxis.Items; | |
| axisItemCollection.AddRange(new List<AxisItem>() | |
| { | |
| new AxisItem("Monday"), | |
| new AxisItem("Tuesday"), | |
| new AxisItem("Wednesday"), | |
| new AxisItem("Thursday"), | |
| new AxisItem("Friday"), | |
| new AxisItem("Saturday"), | |
| new AxisItem("Sunday"), | |
| }); | |
| xAxis.LabelsAppearance.DataFormatString = "{0}"; | |
| xAxis.LabelsAppearance.RotationAngle = 0; | |
| xAxis.TitleAppearance.Text = "Days"; | |
| xAxis.TitleAppearance.Position = AxisTitlePosition.Center; | |
| xAxis.MajorGridLines.Width = 1; | |
| xAxis.MinorGridLines.Width = 1; |
Set Up Y Axis:
Similar to X Axis, we will need to let the chart know what our Y Axis should look like. You can set the Major/Minor tick types, Major/Minor tick sizes, Max/Min value, Appearance etc. Here is the code snippet to do this:
| //set up y-axis | |
| var yAxis = plotArea.YAxis; | |
| yAxis.Color = Color.Black; | |
| yAxis.MajorTickSize = 1; | |
| yAxis.MajorTickType = TickType.Outside; | |
| yAxis.MinorTickSize = 1; | |
| yAxis.MinorTickType = TickType.Outside; | |
| yAxis.MaxValue = 100; | |
| yAxis.MinValue = 0; | |
| yAxis.Step = 25; | |
| yAxis.LabelsAppearance.DataFormatString = "{0}"; | |
| yAxis.MajorGridLines.Width = 1; | |
| yAxis.MinorGridLines.Width = 1; | |
| yAxis.TitleAppearance.Text = "CPU Load"; | |
| yAxis.TitleAppearance.Position = AxisTitlePosition.Center; |
Setting Up Chart Series:
So far we have just set up the chart with respect to appearance, x axis & y axis. We have not yet provided any data to plot on the chart itself. In order to plot data on the chart we need to provide a Series to the chart. The Series can be Bar/Column/Area/Line etc. In this example i will create a Bar series and add it to charts Series collection. In this example i am creating a hard coded data and adding it to the series. But you have plenty data binding option for the chart. Here is the code snippet of creating a Bar series and adding it to the chart:
| //set up series | |
| var series = plotArea.Series; | |
| var barSeries = new ColumnSeries(); | |
| barSeries.Name = "Week 1"; | |
| barSeries.Items.AddRange(new List<SeriesItem> | |
| { | |
| new SeriesItem(35), | |
| new SeriesItem(52), | |
| new SeriesItem(18), | |
| new SeriesItem(39), | |
| new SeriesItem(0), | |
| new SeriesItem(10), | |
| new SeriesItem(6), | |
| }); | |
| barSeries.Appearance.FillStyle.BackgroundColor = Color.Red; | |
| series.Add(barSeries); |
Running the Application:
Now that we have set up the chart through code, all that is left is to run the app and look at the output. So press F5 in Visual Studio so that your app will be run. Here is the screen shot of the output:
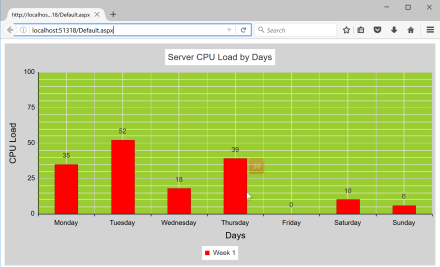
Fig 2 – Chart rendered on a browser
Summary:
RadHtmlChart as a control has very rich Server Side API. Whatever you can achieve in mark up can be done programmatically too. If you anytime have a scenario to plot the chart at run time depending on certain conditions – now you know how to create a chart through code.
Hope this blog post helps you in your project. Do lets us know if you have any feedback/suggestions through comments below.
Till next time – Happy Coding.
