
Read – Revamping Web Applications Part-3 Software Architecture
Read – Revamping Web Applications Part-2 Features
Read – Revamping Web Applications Part-1 Overview
We are in a process of revamping the application. To understand whether we have developed a better application than already existing, we need to set benchmark on the functional aspect and performance of the application. To set the benchmark, we need to perform various kind of tests like functional test, performance test etc.
We will start with setting performance benchmark. For that we need to do PERFORMANCE TESTING of existing application. We are going to use Telerik Automated Testing tool “Test Studio “for this purpose.
Test studio can perform following types of testing
- Automated functional test of web application
- Performance test
- Load test
- WPF test
Learn more about Test Studio here
Using Test Studio Performance benchmark can be set in three steps
- Create a valid functional test
- Configure performance counter
- Execute performance test
Here is the screenshot of how the Test Studio defines it.

Step 1: Automated functional test of web application
In order to create valid functional test, we recorded the test on existing application as following,
1. Open Test Studio
2. Configure whether its trial and purchased.
3. Now let’s create a new project for our Event-Networking (EN) application
Go to File -> New
or just click Create New Project in the centre of the screen
4. New Project Pop-Up window would appear
specify the Project Name. Here we have named it “ENTest”
specify the Location to store the Projects. Here we have chosen the default path which is “C:\Users\Shantanu\Documents\Test Studio Projects”
![clip_image002[6]](https://telerikhelper.net/wp-content/uploads/2013/03/clip_image0026.jpg "clip_image002[6]")
5. Getting started window would appear. To explore more about Test Studio click here.
6. Now we are under Project tab.
Right click the project node created by default and click Add New Test.

7. Next we are on Select Test Type window. We will select Web Test option because we are creating a performance testing module for testing of our web application. Here let’s name it “AttendeeProfile_IE&Chrome” as we will be doing the performance testing on both the browsers.
8. Once the Web Test has been added to Project, hover over it. This will show a menu with Record and Play button. Press Record button. This will open Internet Explorer. Here we enter the URL of our website needed for testing. Then perform all the tasks to be recorded and tested. Here we have taken the attendee-list which is the default page of the web-application.


9. After recording all the steps close the Internet Explorer and all events will be recorded and now we will enter the Test tab.

10. From the Quick Execution toolbar select a browser and Run the testing environment. This process will let you know whether all your event are being executed successfully in that particular browser. Here Internet Explorer browser is used.
11. Once the testing is done it will prompt you to save it. If all the events have passed, a check sign would appear left to all the events. If the process has terminated without completing then a cross sign will appear at the event where the execution has stopped and the rest of the events would have a negative sign depicting that part is untouched. To save the Web Test or not depend on the developer but I recommend saving it.

12. While recording, we sometimes need to simulate some of the events to be real, like clicking button, selecting options from drop-down lists, typing etc. We can do so by selecting SimulateRealTyping for texts and SimulateRealClick for buttons. These are the two simulations we have used in our current test.
![]()
Step 2: Configure Performance Counters
Within the Test Studio in the menu bar you will see the Performance tab. Here we need to configure the setup parameters and performance counters.
1. Click Configure button.
2. Give you settings a name. I have named it“My Computer”. Check the Gather Performance Data and click Add Computer. In the Computer section, enter the IP address of your website which you want to test and click connect. Here 127.0.0.1 is used because my web application is on the localhost. 127.0.0.1 which defines the IP of my own PC. You should get a confirmation in red, left to the button.
![clip_image002[8]](https://telerikhelper.net/wp-content/uploads/2013/03/clip_image0028.jpg "clip_image002[8]")
The most important part is to select the parameters which is under the Performance Counters tab. The counters used in this project are shown below. You even have the functionality to calculate the Time To First Byte (TTFB).

Step 3: Execute Performance Test
1. The next and final step is to start the Performance testing by clicking the Quick Run button.
![]()
Internet explorer will open again but this time you do not have to type or click anything as the Web Test is automated. Once the IE closes we will see the following window.
![clip_image004[5]](https://telerikhelper.net/wp-content/uploads/2013/03/clip_image0045.jpg "clip_image004[5]")
This is an intermediate screen and will disappear in few seconds.
2. Next up is the actual overview of all the events. On execution we can see time taken by each test step or user actions. This view only shows the Total time taken at server and client side and the size of the packets of each event. To get the details of each event you can either click the Details button in the Ribbon categorized under Views or simply click the event to get individual data.
![clip_image006[5]](https://telerikhelper.net/wp-content/uploads/2013/03/clip_image0065.jpg "clip_image006[5]")
![clip_image008[5]](https://telerikhelper.net/wp-content/uploads/2013/03/clip_image0085.jpg "clip_image008[5]")
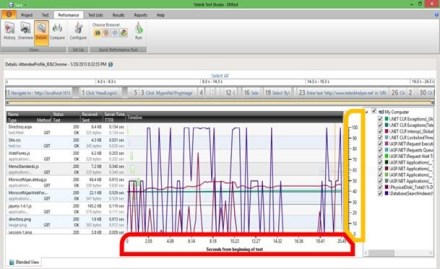
3. To see graph of all the event we need to click on Select All tab. We could also get performance over a range of restricted timeframe.
4. Here the performance testing is executed for all the functions from the application. The right-pane shows the performance counters. These parameters are plotted on X-Y (Red-Orange) axes graph with X being the ‘Seconds from beginning of the test’ and Y being “Percentage”. The plotted graph remains static on the screen whereas the function in the left-pane are scrollable. This will help depict the functions which are causing spikes by synchronizing the timeline with the graph; as X axis is same for both constraints.
5. Next we have a History tab which keeps a track of all the testing done till date and all the reports generated. Here, we can see different Test Time and a graph plotted with X-Y axis being Profile timeline and Test Time. This gives us a general idea of how our existing application is behaving.
We can also compare two Profiles at different times and look for the common loopholes to be solved.
We could set one of the profiles as the benchmark for all the other profiles just by clicking the hour-glass symbol on the left.

Conclusion
In this post we set a benchmark by executing Performance Testing of the web application and in the next blog we will talk about possible enhancements and extensions which can be made in the existing web application.
Read – Revamping Web Applications Part-5 Proposed Enhancements


