In this post we will take a look on working with RadChart in JavaScript based Application for Windows Store. We will follow step by step approach in this blog post.
Step 1: Add References
Very first we will add Telerik JS and CSS files references in the project. If first time you are working with Rad Controls in Windows 8, I suggest you to read blog post to setup the environment
After adding the files in the project we need to refer them on the html file . Files can be referred as given in following code snippet.
<!--Telerik References -->
 <script src="/Telerik.UI/js/jquery.js"></script>
 <script src="/Telerik.UI/js/ui.js"></script>
 <link href="/Telerik.UI/css/dark.css" rel="stylesheet" />
 <link href="/Telerik.UI/css/common.css" rel="stylesheet" />
Step 2: Create a Chart
A chart can be created by setting data-win-control attribute of a div as Telerik.UI.RadChart.

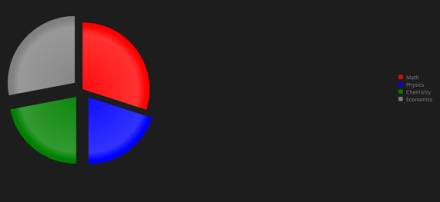
At this point if we go ahead and run the application, we will get an output something like below

Step 3: Add Series
We can add series to a chart in two ways
- Declaratively in HTML
- Programmatically in JavaScript
Declaratively a series can be added by setting value of data-win-options. In following code snippet we are creating one series in the chart.
<div id="performancechart" data-win-control="Telerik.UI.RadChart"
data-win-options="{
series: [
{ type: 'column', name: 'Runs', data: [1000, 860,425,956,320]}
]
}"
/>
Series takes three parameters
- Type of the series
- Name of the series
- Data to be displayed in the series
In above code snippet, we are creating column type of series with name Runs and 5 data points. At this point if we go ahead and run the application, we should get a chart as following.

Programmatically chart series can be created as following,
var performancechart = document.getElementById("performancechart").winControl;
var wicketcolumnseries = new Telerik.UI.Chart.ColumnSeries();
wicketcolumnseries.data = [30,100,67,123,49];
wicketcolumnseries.name = "Wicket";
wicketcolumnseries.color = "green";
wicketcolumnseries.visibleInLegend = true;
performancechart.series.push(wicketcolumnseries);
performancechart.refresh();
In above code snippet following tasks has been performed
- Line 1: Getting reference of Chart as win control
- Line 2: Creating series of type Column
- Line 3: Setting data for the column series
- Line 4: Setting name of the column series
- Line 5: Setting colour of series
- Line 6: Making sure series is visible in Chart Legend
- Line 7: Pushing created column series to the series collection of chart
- Line 8: Refreshing the chart
Let us add one more series to chart declaratively in HTML.
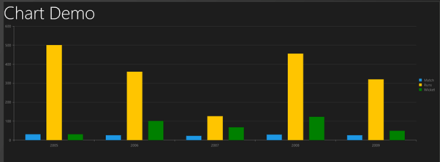
<h1>Chart Demo</h1>
<div id="performancechart" data-win-control="Telerik.UI.RadChart"
data-win-options="{
series: [
{ type: 'column', name: 'Match', data: [30, 25,22,28,25]},
{ type: 'column', name: 'Runs', data: [500, 360,125,456,320]}
],
}"
/>
So far we have added three series to chart. At this point of we go ahead and run the application then we should get a chart as following

There are many other types of series. We will explore them one by one in further posts.
Step 4: Add Category Axis
Category Axis can also be added in two ways,
- Declaratively in HTML
- Programmatically in JavaScript
In HTML we can add Category Axis as following
<div id="performancechart" data-win-control="Telerik.UI.RadChart"
data-win-options="{
series: [
{ type: 'column', name: 'Match', data: [30, 25,22,28,25]},
{ type: 'column', name: 'Runs', data: [500, 360,125,456,320]}
],
categoryAxis: {
categories: [2008, 2009, 2010, 2011, 2012]
}
}"
/>
In JavaScript we can add Category Axis as following code snippet,

On running we will find chart with Category Axis as following,

Step 5: Working with Tooltip
We can configure tooltip at two levels
- At the chart level
- At the series level
Chart level tooltip can be configured as following snippet,
<div id="performancechart" data-win-control="Telerik.UI.RadChart"
data-win-options="{
series: [
{ type: 'column', name: 'Match', data: [30, 25,22,28,25]},
{ type: 'column', name: 'Runs', data: [500, 360,125,456,320]}
],
categoryAxis: {
categories: [2008, 2009, 2010, 2011, 2012]
},
tooltip: {
visible: true
}
}",
/>
At the series level we can configure tooltip as following

Now on running of the application we will find that when we move mouse on the chart values of the series are displayed as tooltip.
Final chart should look like as following,

For your reference full source code is given below,
<!DOCTYPE html>
<html>
<head>
<meta charset="utf-8" />
<title>TestDemoJavaScript</title>
<!-- WinJS references -->
<link href="//Microsoft.WinJS.1.0/css/ui-dark.css" rel="stylesheet" />
<script src="//Microsoft.WinJS.1.0/js/base.js"></script>
<script src="//Microsoft.WinJS.1.0/js/ui.js"></script>
<!--Telerik References -->
 <script src="/Telerik.UI/js/jquery.js"></script>
 <script src="/Telerik.UI/js/ui.js"></script>
 <link href="/Telerik.UI/css/dark.css" rel="stylesheet" />
 <link href="/Telerik.UI/css/common.css" rel="stylesheet" />
<!-- TestDemoJavaScript references -->
<link href="/css/default.css" rel="stylesheet" />
<script src="/js/default.js"></script>
</head>
<body>
<h1>Chart Demo</h1>
<div id="performancechart" data-win-control="Telerik.UI.RadChart"
data-win-options="{
series: [
{
type: 'column',
name: 'Match',
data: [30, 25,22,28,25],
tooltip: {
visible: true
}
},
{ type: 'column', name: 'Runs', data: [500, 360,125,456,320],}
],
categoryAxis: {
categories: [2008, 2009, 2010, 2011, 2012]
}
}",
/>
</body>
</html>
Future Post
In this post we learnt basics of working with Rad Chart. We focused on only one type of series. In further posts we will explore various series type and working with remote data in the Rad Chart. I hope you find this post useful. Thanks for reading.