In my last post, i took a look at how to use SQLite database in Telerik Reporting Standalone Report Designer. In this post, i have recorded a short 10 minute video which provides you step by step instruction on how to use SQLite database in Telerik Reporting Standalone Report Designer. Continue reading →
Couple of years ago, I created a video where I showcased how to use Telerik Reporting with WPF (Windows Presentation Foundation). WPF is a windows application development framework on Microsoft .NET stack. Telerik Reporting is a reporting solution which can be embedded in your ASP.NET/WinForms/WPF applications. You design reports, host it in your app and render within your apps. One of the question I got recently on that video was – “How to use Telerik Reporting with SQLite ?“. That’s an interesting question and probably one of the common scenarios you may face. In this post I will take a step by step approach on how to work with SQLite using Telerik Reporting Standalone Report Designer. Lets get started. Continue reading →
We are at the last week of 2016 and getting ready to welcome 2017. We wish you all a very Happy & Prosperous Happy New Year 2017. We here at Progress are busy trying to bring you new learnings in 2017. Our team has been brainstorming on possible topics for Jan/Feb 2017 webinars and we cant wait to make it live. In this blog post we take a look at the Jan/Feb 2017 Webinar Schedule. So read on. Continue reading →
On Jun 25 2015 we finished one more webinar. This time we looked at “Building and Delivering Reports from your Web and Mobile Apps with Telerik Reporting”. This blog post is the recap of the webinar. You will find the slide deck and video recording of the webinar in his blog post.
Telerik Reporting:
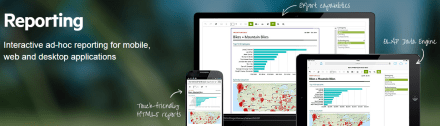
Telerik Reporting is a reporting solution for all .NET cloud, web, and desktop platforms that provides a full range of ready-to-use tools and services to help people throughout your organization create, deploy, and use reports quickly and easily. With Telerik Reporting, you can retrieve data from relational, multidimensional, ORM or custom data layer based data sources; The ready reports can be viewed in various formats (including PDF, Microsoft Office Word and Excel and PowerPoint documents); and can be viewed with a dedicated viewer in a Web or .NET Desktop application.
And here is the video recording of the webinar. If you missed attending the webinar you can catch up at your leisure time by going through the recording below:
Recently, i was talking to a customer who was evaluating Telerik Reporting. They were on Visual Studio 2013 and wanted to use Telerik Reports in WPF application. But they were having difficulty getting started with our Reporting. In order to make things easier, i have recorded a getting started video for Telerik Reporting using Visual Studio 2013 and consuming the report in WPF application.
Here is the video:
Hope this helps anybody who is working on our Reporting software & WPF platform.
On Feb 27 we presented a webinar on our Telerik Reporting suite. The webinar was titled “Take Your Reports to Any Screen with Telerik Reporting”. In this blog post we will recap the webinar for those of you who couldn’t not make it live.
Telerik Reporting:
Telerik Reporting is a lightweight reporting solution for all .NET cloud, web, and desktop platforms (ASP.NET, Ajax, Silverlight, WPF, Windows Forms, and Azure) which targets developers and end-users. Rich interactive and reusable reports can be created by developers in Visual Studio, and by end users in the desktop-based Report Designer. With the help of Telerik Reporting users can examine and probe data, export reports to Microsoft Office Word and Excel for further analysis, and even present them as PowerPoint documents.
We record all our webinars for the benefit of on demand viewing. So if you missed attending the webinar live don’t worry, here is the recorded video of the webinar:
Questions & Answers:
Q: Is it possible to convert existing reports in to this?
A: Telerik Reporting has conversion wizards for Crystal Reports, Active Reports and Xtra Reports.
Q: Is this compatible with ORACLE data source? A: Telerik Reporting supports Microsoft SQL Server Analysis Services cubes, ADO.NET data sources, relational databases, business objects, ORMs and XML. So as long as ORACLE has a ADO.NET Data Provider we will support it.
Q: Is there possibility to have chart and table is same report?
A: Yes. Chart and Table are what we call as Report Items. So they can be placed together and bind data accordingly. You can check our dashboard Reporting demos which showcase this.
Q: I have 5-10 reports with data displayed in different formats(table,graph…). I would like to apply same text font for all those reports. Is it possible?
A: Yes you can. You can use external style sheets to apply the same styles in different reports – Exporting and Reusing Style Sheets
Q: is it possible to convert vs2010 local reports to telerik reports?
A: We do not have converters from SSRS reports, because there is a great difference in the reports’ structures.
T-Shirt Giveaway:
If you are a regular to our Telerik India webinars, you will know that we select 2 random names from the webinar attendee list and they get our cool Telerik .NET Ninja t-shirt. So here are the 2 winners from this webinar:
Rajan Thaora
Keerti Valmiki
Congratulations to the winners. We will contact you to get you address so that we can ship the t-shirt. Others don’t worry, you can try your luck in our next webinar.
On Jun 13th we conducted a webinar titled “Reporting Solution for ASP.NET Applications using Telerik Reporting”. This is part of an ongoing webinar series we here at Telerik India are doing targeting APAC region. We call this the Telerik .NET Ninja Developer Webinar Series. You can take a look at the Jun-Jul schedule here: https://telerikhelper.net/2013/05/24/telerik-webcasts-june-july/
Telerik Reporting is a lightweight reporting solution for all .NET cloud, web, and desktop platforms (Azure, Silverlight, WPF, ASP.NET and Windows Forms) which targets developers and end-users alike. Rich interactive and reusable reports can be created by developers in Visual Studio, and by end users in the desktop-based Report Designer. With the help of Telerik Reporting users can examine and probe data, export reports to Microsoft Office Word and Excel for further analysis, and even present them as PowerPoint documents.
Slide Deck:
Here is the slide deck which I used for the webinar:
Webinar Video:
As usual we have this webinar recorded. So if you missed attending the webinar live, you still have a chance to catch up and that too at your own time. Here is the video recording:
Question & Answers:
During the webinar may questions were asked by the audience. We tried our best to answer as many as we can. We will try to address each and every questions from the webinar in this section.
Q: How to save report data in cache?
A: Data is provided to a Telerik Report using the DataSource property. So you can actually make use of the ASP.NET Caching mechanisms and store your report data. Then at runtime read the data from cache and provide it to the report data source.
Q: Does report have any source code?
A: Yes. The Report is a POCO class inhering from Telerik.Reporting base class. So although you design the report using the designer, it is basically a C# class file under the hood.
Q: Is it building the app while we see the preview?
A: When you preview, yes the class library project in which the report is hosted is built.
Q: Difference between Preview and Html Preview?
A: Preview uses Windows Host and it is as if you are hosting the report in a Windows Application. Html Preview uses IE as the host and it is as if you are hosting the report in a Web Application.
Q: How to create report from WCF service?
A: You can always feed the report with a data coming from WCF Service. Telerik Reporting support Business Objects as a valid data source.
Q: Can we export the report using report viewer?
A: Yes, absolutely. Export to PDF, Excel and other formats.
Q: Can we style and individual cells? and copy the style from one to other?
A: Yes each individual cells can be styled. You can copy one style to another in the designer.
Q: Can’t we add this thumbnail Image in during report creation through wizard ?
A: Yes you can. The demo was to showcase our Data Explorer window feature which makes it easy for your to drag and drop data fields on to the designer.
Q: will the Telerik menu come if we install Telerik Reporting in our machine
A: Yes. when you install Telerik Reporting you will see the Menu Item inside your VS.
Q: Can we give parameter at run time?
A: You normally define the report parameters at design time itself and use the report parameters in your queries to filter. You can always set value of a parameter at run time.
Q: Can we create a drop down list instead of textbox to pass a parameter?
A: Yes you can. In fact you do not have to do anything except to say that the report parameter supports MultiValues. You do this by setting the MultiValue=true in the report parameter properties.
Q: If any changes is done to Report Library as in this case today, will it get auto refresh?
A: You will need to redeploy the report library DLL to you Web Application Bin folder and you will have the refreshed report.
Q: Can we schedule the report subscriptions like SSRS?
A: Nope. Telerik Reporting is not a side reporting solution. So out of the box we do not have this feature. But having said that – its easy to build it. The reports are nothing but C# classes under the hood so you can build a scheduling agent which programmatically creates the report, export it to a format of your choice and send it through email.
Q: Can we call this report from c# code without report viewer and get result in the PDF file?
A: Yes you can. The report is basically a C# class file. You can instantiate this at runtime and export to any format of your choice.
Q: Can we edit any grid row/column as in other grid?
A: No. This is reporting so no editing feature.
Q: Can we use any of web control as input parameter for report viewer?
A: You do not need to use any web control. Report Viewer itself is a control as part of our RadControls for ASP.NET AJAX suite.
Q: Do you have loading window when you click on Print Preview?
A: Yes we have. When you click on Print Preview, we will show a “Generating Report” loading animation.
Q: Can we expand/collapse a particular group as a bunch of values?
A: Yes you can. The Expand/Collapse feature is supported.
Q: How can we display the Telerik reports using viewer in Winforms?
A: WinForms suite also contains Report Viewer control. So the same report can be displayed on WinForms too.
Q: Can we create charts – like pie, bar charts? A; Yes you can. Check out our demos to take a look at the charting capabilities.
Q: Can we have dependency of parameters, ex: first parameter is Countries, when country is selected, States should be displayed in second parameter
A: Yes you can. The cascading of parameters is possible.
Q: Can we directly print reports without print preview?
A: Yes. The report viewer has a print report button which will invoke the OS print dialog.
Q: Export functionality is inbuilt or we need to do some coding for it?
A: Export to different formats is in built in Report Viewer control. You don’t have to do anything extra to use the feature.
Q: Can I email the report directly without showing the report to user?
A: You will need to use Reporting API to achieve this functionality.
Q: Will it also be compatible with the recent version s of any report viewer like with excel 2010 or later versions?…I am asking in terms of generating output format
A: Yes the generated reports are compatible.
Q: Can we have docs/examples to implement Telerik reporting – sample projects?
A: Sample projects are installed once you install Telerik Reporting on your machine. More demos can be found at: http://demos.telerik.com/reporting/home.aspx
Q: Can we put a calendar in filters ?
A: When you create a parameter of type Date/Time, the UI for that parameter is automatically rendered as a calendar.
.NET Ninja T-Shirt Giveaway:
we select 2 person from the webinar attendees and give away our .NET Ninja T-Shirt in each of our webinars. we have picked up 2 lucky persons in this webinar too. They are:
Manoj Singh
Sulabh Sarna
Congratulations to the winners. We will be contacting you shortly and we will ship your t-shirts. Rest of the folks don’t worry – we still have loads of webinars lined up for this year. So do attend our future webinars without fail and try your luck to be the .NET Ninja.
In this post we will take a look at how a report designed in Standalone End User Report Designer, can be rendered from your applications – be it WPF, WinForms, SilverLight or ASP.NET. One of the customer I was working with had this requirement of end users to design the report and that report should be rendered within the application. The end users who design the report will have the flexibility to upload the designed report to the application. The application had to render the uploaded report in a reporting module. So we will see how to achieve this. If this requirement has excited you, then read through rest of this post.
Pre Requisites:
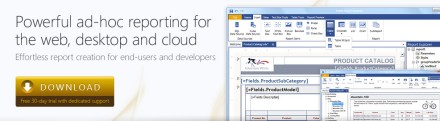
In order to design reports using the standalone end user report designer, you will need to first download the Telerik Reporting solution. This is available as a free 30 day trial download. Here is the download link:
in order to mimic the scenario of End User connecting to a staging DB and designing the report on their desktop – I will be making use of 2 Databases. So you will need a RDBMS product of your choice. In my example I will be using SQL Server 2012.
Creating Staging and Production DB:
For the sake of the demo, I will create 2 database and name them as StagingDB and ProductionDB respectively. The database will have only one table named Contacts. It will have 2 columns an Id and Name. Here is the code snippet for the table:
This file contains hidden or bidirectional Unicode text that may be interpreted or compiled differently than what appears below. To review, open the file in an editor that reveals hidden Unicode characters.
Learn more about bidirectional Unicode characters
So at his time, if you are following along, you should have created 2 databases – StagingDB and ProductionDB and in both the DB you should have 1 table named Contacts. In staging DB contacts table I will fill some dummy data and it looks like below:
Similarly in the Contacts table of production DB, I have inserted the following data:
We will mimic a scenario where in the end users will connect to the StagingDB->Contacts table and design the report using the Standalone Report Designer. After designing it they will upload to the application. And application will connect to production DB and render the report.
Designing the report:
when you install the Telerik Reporting suite, we will also install the Standalone report designer for end users. This is an executable which can be run on any system. It can be in a folder named Report Designer at the root of Telerik Reporting installation folder. When you launch the ReportDesigner,exe, you will see the following interface:
Click on New Report, give a name for the report and select a path to save the report.
Next, we will be presented with a Report Wizard. In the “Choose Data Source” dialog, create a new data source and connect to the Staging DB we have created earlier. In order to connect to our SQL Server database, select SQL Data Source in the data source selection dialog and give it a name.
In the data connection selection page, configure the connection settings to your Staging DB.
Next we configure the command i.e. the select query to fetch the report data. For this demo it’s a simple statement – “Select * from Contacts”. Next you can preview the results of the query
Click on finish to finish the connection settings configuration.
Now you will see that we have set up a data source for the report and following dialog shows the details:
Click next to select the report type. I have select a standard report type
Next we will configure the data layout of the report, In this example, we have only two columns in the table and I will show both the column in the body of the report.
Next select the report layout i.e. is the report a stepped report or outline or left aligned. I have selected Stepped report i.e. items are arranges in columns and they don’t overlap vertically.
Next you can select a report style and finish the wizard.
At this point we have successfully designed a report using the report designer. In order to preview the report, click the Preview button on the Home tab. The report will be executed and shown as below:
As you can see we have connected to our staging db and pulling data from the contacts table.I have named the report as DemoReport and is saved as DemoReport.trdx. The TRDX is a custom file format that Telerik Reporting uses. It stands for Telerik Reporting Definition XML. Next we will see how we can upload this file to a application and render the report inside the application.
Building a WPF client:
In order to mimic a production application, I have built the following WPF app.
Although I have selected WPF app for this demo, it can be anything in real world – ASP.NET Web App, WinForms or SL. Here is the work flow of this app:
An end user uploads the .TRDX report file he designed using the Standalone Report Designer, in the app.
The app saves the file in the application folder.
App will list the uploaded report file in a list box.
When the report is selected in the list box, the report will be rendered in the report viewer.
For the sake of the time, I will not be describing the portion of the app which allows us to browse and select a .TRDX file, Saves the uploaded .TRDX file in one of the application folder and listing of the uploaded report in list box. Those are pretty straight forward code that you will be familiar with. We will pay our attention to how do we render the .TRDX file inside the Report Viewer in the coming sections.
TRDX Report Rendering using URI:
The report viewer has the capability to just take a URI of a .TRDX file and render it. The ReportViewer exposes a property called ReportSource. One of the supported report source is UriReportSource. As the name goes, we are supposed to create an instance of UriReportSource and set the URI to the .TRDX file. Be it a WPF app as the one we are dealing with now or a web scenario – you just need to get the complete URI of the .TRDX file. Here is the code snippet to achieve this:
This file contains hidden or bidirectional Unicode text that may be interpreted or compiled differently than what appears below. To review, open the file in an editor that reveals hidden Unicode characters.
Learn more about bidirectional Unicode characters
In previous section we saw UriReportSource as the report source for the report viewer. The report viewer also supports XML as a report source. We can pretty much give a XML literal string which confronts to Teelrik Reporting Definition XML schema and the report viewer will be able to parse and render the same. The .TRDX report file is nothing but a XML in itself. Here is the content of the DemoReport we designed in its XML form:
This file contains hidden or bidirectional Unicode text that may be interpreted or compiled differently than what appears below. To review, open the file in an editor that reveals hidden Unicode characters.
Learn more about bidirectional Unicode characters
Here is the code snippet to prepare the XmlReportSource and bind that to ReportViewer ReportSource.
This file contains hidden or bidirectional Unicode text that may be interpreted or compiled differently than what appears below. To review, open the file in an editor that reveals hidden Unicode characters.
Learn more about bidirectional Unicode characters
Well, if you followed the post so far, you will probably be getting this question for sure. Well remember that when we designed the report using Standalone Report Designer we did set up a data source and a connection string. But that points to our staging database. Meaning the schema of the staging db and the production db are the same but they will be two different environments when it comes to reality. You will never allow somebody to work with a production environment for design. Instead you will allow people to play around in the staging or local setup and finally deploy the code to production. So when we rendered the report using the URI Report Source or XML Report Source – the report does contain the data source object embed within the report and will use that when executing in the production. Remember that the connection string set up during design points to our staging or local setup. So when the report is rendered in the production, report viewer will search for the connection string name given during the design. It may be there or may not be there – whatever it is, this is not ideal scenario to support. So how can we overcome this. In the next section, we will see what is the solution for this.
Report Xml Serializer:
when we looked at XmlReportSource, we understood the .TRDX file is nothing but a XML content. It is nothing but the report definition. The Telerik Reporting solution comes with a ready made XmlSerializer which can read this XML definition and gives us an instance of Telerik.Reporting.Report – an object representation of the Report we designed. The Report class exposes the Data Source we set up and the Connection String on that data source. So the solution to render a .TRDX file in production environment will be as follows:
Read the content of the .TRDX file as XML string
Use ReportXmlSerializer to serialize the XML to Report object
On the report object, get the SqlDataSource and change the connection string of the data source to match your production. You can either provide the complete connection string itself or the name of the connection string element from your configuration file.
Here is the code snippet on how to use the Report Xml Serializer:
This file contains hidden or bidirectional Unicode text that may be interpreted or compiled differently than what appears below. To review, open the file in an editor that reveals hidden Unicode characters.
Learn more about bidirectional Unicode characters
Standalone Report Designer is a great tool for end users who just create reports and are not technical people. Telerik Reporting Solution has provisions to use the designed report i.e. .TRDX file and render that inside the report viewer. Since it supports both URI Report Source and XML Report Source, you can decide the way you want to store the report i.e. either store it as a physical file in your app in a separate folder or store the content of the .TRDX file in a database column. In both the cases you will be able to use the Report XML Serializer to serialize the XML as a Report instance, update the connection string to match your production and set it to the report viewer.
With Telerik Reporting Solution, you now have the power in your apps to let the end user design adhoc reports, upload it in your app and render the same in a report viewer. Hope this post gave you some insights into Telerik Reporting capabilities.