Getting Non-religious with React Library – Part I (The Concepts)

The Javascript wars are raging! Are you with the purist Javascript nerds or on traditional jQuery’s side or would you prefer lean React or does Google’s AngularJS get your mojo? This post isn’t about this religious debate.

This three part series is going to introduce the React to developers. React was created by Facebook and is supported by them.

We start slow in this post but will end with a working example of React application. We are interested in building an enterprise application and would end up adding a Grid to the page in Part III of this post.

The one thing I love about React is that it is non-religious. It is ready to embrace any JavaScript technology that you can throw at React. React is a very light weight framework and only contains the capability of rendering the view. React makes no assumptions about the rest of the technology stack used and can plug in with any Model or Model View framework.

Surprisingly with all that versatility, React is very simple to learn and can be introduced incrementally into an existing project (part running React and part running jQuery).

Here are some concepts to be aware about:

  1. Virtual DOM: Virtual DOM is a shadow of the page DOM but is never updated. It is only destroyed and re-rendered for the specific components that have changed. This makes updates blazingly fast.
  2. One Way Databinding: Closely tied to the above, only inputs are accepted as change of state. Change in the property doesn’t trigger the update on the DOM automatically.
  3. JSX: This is a JavaScript extension that allows XML to be embedded within React components directly. Think of this as a light weight template library.
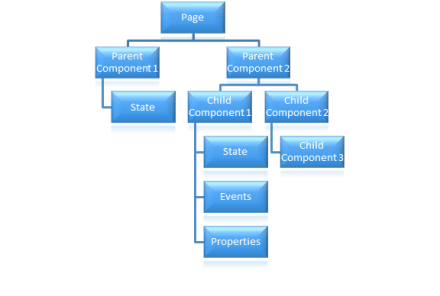
  4. Classes/ Components: The heart of React. Everything rendered by React is a component. Components are composable and can be composed of additional components.
    1. Properties/ Props: React Components have properties that are used to accept input from other components and used to render the components directly.
    2. Events: Allows components to respond to various input activities.
    3. State: Components can maintain state that is only available to the specific component i.e. sort of a private data.
  5. References: One way binding constructs that allow inputs to be accessed from the backend.
  6. Developer Tools: React Developer Tools are available for Chrome and Firefox as a browser extension for React. It allows you to inspect the React component hierarchies in the virtual DOM.

React CLI

The easiest way to get started with React is through create-react-app CLI (the official React CLI). So, fire up your command line interface and get cracking..

First install the create-react-app:

npm install –g create-react-app

Then we can create a new app, and that bootstraps the entire application. We simply use “create-react-app my-app” and render it with npm start. Remember to browse to the root directory where you want to create your node application. I tend to keep my node projects in the “Documents\nodeprojects” directory.

create-react-app my-app

cd my-app

npm start

These commands just runs through a npm script to set up a server for us and kick off the app. You should see a screen as follows:

Note: It does take a while to install everything. Have patience as npm creates the first React app for you.

This was probably the fastest way to get started with node. In the next part, we will cover building a React application from scratch.

Resources for webinar “JavaScript Task Runners for Web – Gulp & Grunt”

On Jan 28 2016 we conducted yet another webinar and we focused on “JavaScript Task Runners for the Web” this time. Client side development has undergone tremendous changes and the workflow you use has also changed. You now use what are known as Task Runners which when run perform certain mundane tasks such as Minification, Concatenation, launching web server, reloading the rendered pages etc. These are made possible through certain client side build tools called as JavaScript Task Runners. In this webinar we took a lap around two popular frameworks namely “Gulp” & “Grunt”. This blog post is a recap of the webinar in case you missed attending live.

Continue reading

ES6

Resources for Webinar “10 Useful New Features of ECMAScript 6”

On Aug 20 2015 we did a webinar titled “10 Useful New Features of ECMAScript 6”. This blog post is a recap of the webinar. You will find the slide deck used in the webinar and the video recording of the webinar in this blog post.

ES6

ES6

Slide Deck:

Here is the slide deck used in the webinar:

Video Recording:

We record our webinars so that you can view them at your leisure time. So here is the video recording of this webinar:

Hope you like the webinar. Do let us know if you have any feedback/suggestion for us.

Telerik NativeScript

Resources for webinar “Build Truly Native Android & iOS Apps from Single JavaScript Codebase”

On Apr 30 2015, we conducted one more webinar titled “Build Truly Native Android & iOS Apps from Single JavaScript Codebase”. This blog post is a recap of the webinar. In this blog post you will be able to get hold of the slide deck & the video recording of the webinar.

About NativeScript:

NativeScript is a new technology that we i.e. Telerik have open sourced to the community. Using NativeScript you will be able to build truly native Android & iOS from a single code base with JavaScript as a language. You can know more about NativeScript from its home here: ww.nativescript.org.

Telerik NativeScript

Telerik NativeScript

Slide Deck:

Here is the slide deck used for the webinar:

Video Recording:

Here is the video recording of the webinar:

Additional Links:

Here are some more videos on NativeScript:

NativeScript Launch Keynote: https://www.youtube.com/watch?v=8hr4E9eodS4

How NativeScript Works: https://www.youtube.com/watch?v=I3_ZnWTj-NA

How to build Apps with NativeScript: https://www.youtube.com/watch?v=Glh927vSYKo


Till next time – Happy Coding.

Resources from webinar Node.js development using Visual Studio

On Jan 23 2014 we conducted the webinar on “Node.js development using Visual Studio”. This blog post will provide you some of the resources from the webinar like Slide Deck, Video recording of the webinar and source codes used in the demo.

Download source code and slide from webinar here

Node.js

Node.js is asynchronous event driven server side JavaScript. It is written in C++ and runs on Google V8 engine. Servers created using Node are high at performance and scalable. It perform File, DB and IO operations in non-blocking way.

Learn more about Node.js here

Slide Deck

Here is the slide deck from the webinar:

Video

As with every webinar, we have recorded this one too. Here is the video recording of the webinar for your leisure viewing

Download source code and slide from webinar here

T-Shirt Give Away

Every webinar we give away two .NET Ninja T-Shirts which have become quite popular among developers. In this webinar we have selected the following 2 persons to receive our t-shirt.

  • Ishitva Goel
  • Ramesh Pyru

Congratulations to the winners. We will contact you on the email address you have provided to us. We will ship the t-shirt to your address.

Thanks for attending webinar.

Download source code and slide from webinar here

MVVM using Kendo UI in three simple steps

Learn more about Kendo UI here

Find sample used in this blog on JSFiddle

Yes I know you love Kendo UI and you love MVVM as well. There are many libraries out there like Knockouts to help you creating HTML5 Apps adhering to MVVM pattern. In this post we will learn to create a simple application using MVVM.

Step 1: Create View Model

ViewModel can be created using Kendo.observable. Object of Kendo.observable will notify any changes to view. Let us create a studentViewModel as below.


var studentViewModel = kendo.observable({
                          name: "Dhananjay Kumar",
                          age : 30 ,
                          sayHello: function () {
                              var name = this.get("name");
                              var age = this.get("age");
                              alert("Hello, " + name + "You are" + age + "Years Old") ;
                                               }
                             });

studentViewModel contains two properties and one method sayHello.

Step 2: Create View

In second step let us go ahead and create View. You need to bind ViewModel to view.


<div id="studentview">
          <input data-bind="value: name" />
          <input data-bind="value: age" />
          <button data-bind="click: sayHello">Say Hello</button>
 </div>

Above in studentview , we are binding value of input types and click of button. There are many other HTML properties can be bind using Kendo UI MVVM like Text , Value , Visible , Html etc.

As you see we are using data-bind property to perform binding.

Step 3: Binding View and ViewModel

Third and final step you need to do is to bind View and ViewModel. Either you can bind ViewModel to a particular view (in this case div with id studentview) or you can bind ViewModel to any DOM element using body. Binding can be done as follows,

 kendo.bind($("#studentview"), studentViewModel);

This is all what you need to do to start creating HTML 5 Apps adhering MVVM pattern using Kendo UI. When you run app, you shall get expected output as below,

clip_image002

Last but not least do not forget to add references of KendoUI library in your project.

Find sample used in this blog on JSFiddle

I hope you find this post useful. Thanks for reading.

Learn more about Kendo UI here

JavaScript Objects and Inheritance using Kendo UI

Learn more about Kendo UI here

In this post we will take a look on JavaScript Inheritance using Kendo UI. To start with you create JavaScript object using Literals as following,


var Vehicle = {

model: "car",
 color: "red",
 sayGreeting: function () {

alert(this.model + this.color);
 }

};

There are other two ways to create JavaScript object also exists

  1. Using new operator
  2. Using Object.Create() static method.

Learn more about Objects in JavaScript here

Kendo UI gives you different syntax to create object and for inheritance.

image

Kendo UI gives you different syntax to create a JavaScript Object. You can create same Vehicle object using Kendo UI as below,

 var Vehicle = kendo.Class.extend({

model: "car",
 color: "red",
 sayGreeting: function () {

alert(this.model + this.color);
 }

});

You can use object created using Kendo UI as below,

var v = new Vehicle();
 v.sayGreeting();

You will get output as below,

clip_image001

In kendo UI , you can create object with Constructor as well. Using init method you can add a constructor to object. In below code snippet we are creating object with constructor.


var Vehicle = kendo.Class.extend({

model: "car",
 color: "red",
 init: function (model, color)
 {
 if(model) this.model = model;
 if(color) this.color = color;

},
 sayGreeting: function () {

alert(this.model +" "+this.color);
 }

});

Now you can create object passing with constructor as below,

 var v = new Vehicle("truck", "black");
 v.sayGreeting();

Above we are creating object passing argument to constructor and then calling sayGreeting() function as well. As output you will get alert message.

clip_image001[6]

Now we can extend object using extend method.


var luxuryVehicle = Vehicle.extend(
 {
 brand: "bmw",
 price : "23560$"

});

As you see that we added two more properties in child object. Let us go ahead and create a new instance of this object.


var a = new luxuryVehicle();
 a.color = "dark grey"
 a.sayGreeting();

Above we are overriding color property of parent class and calling method of parent class. As a output you will get overridden value of color and parents value for model.

clip_image001[8]

In this way you can work with object and inheritance in JavaScript using Kendo UI. I hope you find this post useful. Thanks for reading.

Learn more about Kendo UI here

How to work with RadChart in JavaScript based Application for Windows 8

In this post we will take a look on working with RadChart in JavaScript based Application for Windows Store. We will follow step by step approach in this blog post.

Step 1: Add References

Very first we will add Telerik JS and CSS files references in the project. If first time you are working with Rad Controls in Windows 8, I suggest you to read blog post to setup the environment

After adding the files in the project we need to refer them on the html file . Files can be referred as given in following code snippet.


<!--Telerik References -->
 <script src="/Telerik.UI/js/jquery.js"></script>
 <script src="/Telerik.UI/js/ui.js"></script>
 <link href="/Telerik.UI/css/dark.css" rel="stylesheet" />
 <link href="/Telerik.UI/css/common.css" rel="stylesheet" />

Step 2: Create a Chart

A chart can be created by setting data-win-control attribute of a div as Telerik.UI.RadChart.

image

At this point if we go ahead and run the application, we will get an output something like below

image

Step 3: Add Series

We can add series to a chart in two ways

  1. Declaratively in HTML
  2. Programmatically in JavaScript

Declaratively a series can be added by setting value of data-win-options. In following code snippet we are creating one series in the chart.


<div id="performancechart" data-win-control="Telerik.UI.RadChart"
 data-win-options="{
 series: [
 { type: 'column', name: 'Runs', data: [1000, 860,425,956,320]}

]
 }"
 />

&nbsp;

Series takes three parameters

  1. Type of the series
  2. Name of the series
  3. Data to be displayed in the series

In above code snippet, we are creating column type of series with name Runs and 5 data points. At this point if we go ahead and run the application, we should get a chart as following.

image

Programmatically chart series can be created as following,


var performancechart = document.getElementById("performancechart").winControl;
 var wicketcolumnseries = new Telerik.UI.Chart.ColumnSeries();
 wicketcolumnseries.data = [30,100,67,123,49];
 wicketcolumnseries.name = "Wicket";
 wicketcolumnseries.color = "green";
 wicketcolumnseries.visibleInLegend = true;
 performancechart.series.push(wicketcolumnseries);
 performancechart.refresh();

&nbsp;

In above code snippet following tasks has been performed

  1. Line 1: Getting reference of Chart as win control
  2. Line 2: Creating series of type Column
  3. Line 3: Setting data for the column series
  4. Line 4: Setting name of the column series
  5. Line 5: Setting colour of series
  6. Line 6: Making sure series is visible in Chart Legend
  7. Line 7: Pushing created column series to the series collection of chart
  8. Line 8: Refreshing the chart

Let us add one more series to chart declaratively in HTML.


<h1>Chart Demo</h1>
 <div id="performancechart" data-win-control="Telerik.UI.RadChart"
 data-win-options="{
 series: [
 { type: 'column', name: 'Match', data: [30, 25,22,28,25]},
 { type: 'column', name: 'Runs', data: [500, 360,125,456,320]}

],

 }"
 />

&nbsp;

So far we have added three series to chart. At this point of we go ahead and run the application then we should get a chart as following

image

There are many other types of series. We will explore them one by one in further posts.

Step 4: Add Category Axis

Category Axis can also be added in two ways,

  1. Declaratively in HTML
  2. Programmatically in JavaScript

In HTML we can add Category Axis as following


<div id="performancechart" data-win-control="Telerik.UI.RadChart"
 data-win-options="{
 series: [
 { type: 'column', name: 'Match', data: [30, 25,22,28,25]},
 { type: 'column', name: 'Runs', data: [500, 360,125,456,320]}

],
 categoryAxis: {
 categories: [2008, 2009, 2010, 2011, 2012]
 }

 }"
 />

&nbsp;

In JavaScript we can add Category Axis as following code snippet,

image

On running we will find chart with Category Axis as following,

image

Step 5: Working with Tooltip

We can configure tooltip at two levels

  1. At the chart level
  2. At the series level

Chart level tooltip can be configured as following snippet,

<div id="performancechart" data-win-control="Telerik.UI.RadChart"
 data-win-options="{
 series: [
 { type: 'column', name: 'Match', data: [30, 25,22,28,25]},
 { type: 'column', name: 'Runs', data: [500, 360,125,456,320]}

],
 categoryAxis: {
 categories: [2008, 2009, 2010, 2011, 2012]
 },
 tooltip: {
 visible: true
 }

 }",

 />

&nbsp;

At the series level we can configure tooltip as following

image

Now on running of the application we will find that when we move mouse on the chart values of the series are displayed as tooltip.

Final chart should look like as following,

image

For your reference full source code is given below,


<!DOCTYPE html>
<html>
<head>
 <meta charset="utf-8" />
 <title>TestDemoJavaScript</title>

<!-- WinJS references -->
 <link href="//Microsoft.WinJS.1.0/css/ui-dark.css" rel="stylesheet" />
 <script src="//Microsoft.WinJS.1.0/js/base.js"></script>
 <script src="//Microsoft.WinJS.1.0/js/ui.js"></script>

<!--Telerik References -->
 <script src="/Telerik.UI/js/jquery.js"></script>
 <script src="/Telerik.UI/js/ui.js"></script>
 <link href="/Telerik.UI/css/dark.css" rel="stylesheet" />
 <link href="/Telerik.UI/css/common.css" rel="stylesheet" />

 <!-- TestDemoJavaScript references -->
 <link href="/css/default.css" rel="stylesheet" />
 <script src="/js/default.js"></script>
</head>
<body>

 <h1>Chart Demo</h1>
 <div id="performancechart" data-win-control="Telerik.UI.RadChart"
 data-win-options="{
 series: [
 {
 type: 'column',
 name: 'Match',
 data: [30, 25,22,28,25],
 tooltip: {
 visible: true

 }
 },
 { type: 'column', name: 'Runs', data: [500, 360,125,456,320],}

],
 categoryAxis: {
 categories: [2008, 2009, 2010, 2011, 2012]
 }

 }",

 />

&nbsp;

</body>
</html>

&nbsp;

Future Post

In this post we learnt basics of working with Rad Chart. We focused on only one type of series. In further posts we will explore various series type and working with remote data in the Rad Chart. I hope you find this post useful. Thanks for reading.