
In this post we will take a look on working with Pie Charts in JavaScript based Application for Windows Store. We will follow step by step approach in this blog post.
Step 1: Add References
Very first we will add Telerik JS and CSS files references in the project. If first time you are working with Rad Controls in Windows 8, I suggest you to read blog post to setup the environment
After adding the files in the project we need to refer them on the html file . Files can be referred as given in following code snippet.
<!--Telerik References -->
 <script src="/Telerik.UI/js/jquery.js"></script>
 <script src="/Telerik.UI/js/ui.js"></script>
 <link href="/Telerik.UI/css/dark.css" rel="stylesheet" />
 <link href="/Telerik.UI/css/common.css" rel="stylesheet" />
Step 2: Create a Chart
A Pie chart can be created by setting data-win-control attribute of a div as Telerik.UI.RadChart and setting series type as pie
<div id="performancechart" data-win-control="Telerik.UI.RadChart"
data-win-options="{
series: [{
type: 'pie',
data : [
{value:30,category:'Math'},
{value:20,category:'Physics'},
{value:22,category:'Chemistry'},
{value:28,category:'Economics'}
],
lables :
{
visible:true
}
}
]}"
/>
In above code snippet,
- We are setting data-win-control attribute as Telerik.UI.RadChart
- In data-win-options , series type is set as pie
- In data-win-options data is set locally.
- Data array contains two properties. They are values and categories
At this point if we go ahead and run the application, we will get an output something like below

Step 3: Configure More Pie Chart options
You can configure common options of char series as discussed in this blog post . Apart from common options you can configure options like following,
- colorField
- explodeField
- categoryFiled
Assume you have data source as following

You can configure these values for pie chart as following

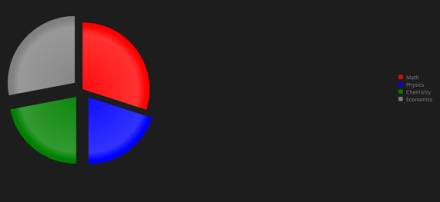
On running you will pie chart as following. You will find that colours of categories have been changed.

You can explode a category as following. Even though in following example we are setting explode attribute with explode property in data array, you are free to set any property of data array as explode field by setting explodeField attribute as we set colorField.

On running you will pie chart as following.

In this we can work with pie charts. Below is the consolidated code of above discussion
<!DOCTYPE html>
<html>
<head>
<meta charset="utf-8" />
<title>TestDemoJavaScript</title>
<!-- WinJS references -->
<link href="//Microsoft.WinJS.1.0/css/ui-dark.css" rel="stylesheet" />
<script src="//Microsoft.WinJS.1.0/js/base.js"></script>
<script src="//Microsoft.WinJS.1.0/js/ui.js"></script>
<!--Telerik References -->
<script src="/Telerik.UI/js/jquery.js"></script>
<script src="/Telerik.UI/js/ui.js"></script>
<link href="/Telerik.UI/css/dark.css" rel="stylesheet" />
<link href="/Telerik.UI/css/common.css" rel="stylesheet" />
<!-- TestDemoJavaScript references -->
<link href="/css/default.css" rel="stylesheet" />
<script src="/js/default.js"></script>
</head>
<body>
<h1>Chart Demo</h1>
<div id="performancechart" data-win-control="Telerik.UI.RadChart"
data-win-options="{
series: [{
type: 'pie',
data : [
{value:30,subject:'Math',color :'red',exlode : 'true'},
{value:20,subject:'Physics',color:'blue',explode:'false'},
{value:22,subject:'Chemistry',color:'green',explode:'true'},
{value:28,subject:'Economics',color:'gray',explode:'true'}
],
field: 'value',
categoryField: 'subject',
colorField :'color',
lables :
{
visible:true
},
tooltip :
{
visible : true
}
}
]}"
/>
</body>
</html>
Future Post
In this post we learnt working with pie Charts. We focused on only one type of series. In further posts we will explore various series type and working with remote data in the Rad Chart. I hope you find this post useful. Thanks for reading.

Pingback: How to work with Pie Charts in JavaScript based Application for Windows 8