RadGrid

RadGrid and SqlDataSource control – Be Careful with your DataSource choice

Overview:

This blog post is in response to one of the customer queries we received a couple of days back. One of our India customer called us up and said that they are seeing slowness in couple of pages where they are using RadGrid. Problem statement was – when they click on “Add New Row” button it takes nearly 1.5 minutes for the row to appear on the grid. This made it even scary for them as they had moved the code to production. Through this blog post I will try to outline what I found out and what could have been done better to resolve the problem.

Analysis:

I went in to a call with the customer and took a look at their code. There were couple of things they were doing. Let me list them down:

  • DataSource for the RadGrid was a SqlDataSource control defined in the .ASPX page
  • They were handling OnItemCommand and OnItemDataBound. They had some logic in this method which would execute on every data bound and every item command
  • The new item template had lot of drop down lists and each of them were bound to SqlDataSource control as their data source.

Now, next thing I did was to take look at the timing. We used IE Developer Tools and captured the network traffic when Add New button was clicked. What I found out was, server was taking close to 10 seconds to finish its server side processing. That’s a lot of time if you ask me. What was surprising for them was, they had paging enabled on the grid. So they were thinking that paging is happening correctly but still why is the add new row scenario slow.

So this made me to delve little bit deeper into what exactly is happening in this scenario. So rest of this blog post is all about my observation. Read on if you have faced a similar problem.

Observations:

Did two experiments to figure out what was happening. First I use a RadGrid and bind it to SqlDataSource control and look at the query executed at the DB side. Second was to use entity data source instead of SQL data source and look at the query executed at the DB.

For my experiments I am using Northwind Database and in particular Order Details table. Order Details table contains nearly 2155 records. So this makes a good candidate to mimic a scenario where you are paging the RadGrid lets say 10 records per page.

I assume that you have RadControls for ASP.NET AJAX suite installed on your system. If not, you can always download from our products page – www.telerik.com/products/aspnet-ajax.aspx. You will need that if you want to follow along with this post. Also in order to trace the SQL Queries executed, I am making use of a open source tool called “Express Profiler” which is available at CodePlex here: http://expressprofiler.codeplex.com/. I had to use this as I have a SQL Server 2012 express edition and express edition does not come with Profiler option. You need a full blown SQL server to get the profiler.

I have created a RadControls Web Application for my experiments. When you install the RadControls for ASP.NET AJAX suite, you will get project templates in Visual Studio, using which you can create a web application.

SNAGHTML47a123f

Fig 1: RadControls Web Application Project Template

DataBinding with SqlDataSource control:

First experiment was placing a RadGrid and bind it to SqlDataSource control. I placed a RadGrid and set its basic properties.  Then added a SqlDataSource control to the page and set its connection string and provided a select command. Here is the code snippet for grid and SQL data source control:

 
    <telerik:RadGrid ID="RadGrid1" runat="server" 
                     DataSourceID="SqlDataSource1" 
                     AllowPaging="true" AllowSorting="true" 
                     AllowFilteringByColumn="true" AllowAutomaticInserts="True"
                     MasterTableView-EditMode="InPlace"  
                     MasterTableView-CommandItemDisplay="TopAndBottom" />
    <asp:SqlDataSource ID="SqlDataSource1" runat="server" 
                       ConnectionString="<%$ ConnectionStrings:NorthwindConnectionString %>"
                       ProviderName="System.Data.SqlClient" 
                       SelectCommand="SELECT * FROM [Order Details]" />

Analyzing the queries:

Now, before you run the application, lets get ready to trace the SQL queries that get executed. You should have downloaded the Express Profiler. Start the express profiler – Set the server details, select the authentication mechanism and finally select the events you want to trace. Here is the screen shot:

SNAGHTML4aaebbd

Fig 2: Express Profiler Settings

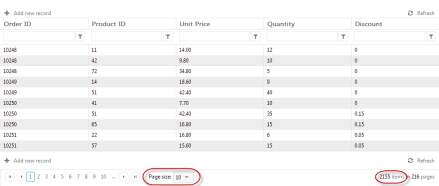
Run the web application. Notice that if we just set AllowPaging=true on RadGrid and do not provide a page size, by default RadGrid puts 10 as the PageSize. So in my case I should see only 10 rows on my first page of the RadGrid. Here is the Grid output:

image

Fig 3: RadGrid output

When I ran the app and looked at the trace, here is what I get:

SNAGHTML4af9b0f

Fig 4: SQL Query Trace for SQL Data Source Control bound to RadGrid

What you see here is a call to retrieve all the records from the table. You may be asking but the page size is set to 10. That is correct but what really happens is this: RadGrid will go ahead and ask SQL Data Source to get the data. SQL Data Source will blindly execute the query that has been set for the select command. RadGrid will not be able to do any tinkering with query because the SQL Data Source does not provide us a chance to put paging related statements.

Now lets do a page change on the grid. I will go ahead and click on Page 2.  RadGrid will now navigate to Page 2. Here is the trace that is generated for this:

SNAGHTML4c8b053

Fig 5: SQL Trace for Page Change Event

What you notice is, the SQL Data Source goes ahead and brings all the records from the table. RadGrid will then pick up only the second page rows and displays it.

Now lets go ahead and click on the Add New Row button and trace the query executed:

SNAGHTML4cdbf80

Fig 6: SQL Trace for Add New Record Event

As you can see it again retrieves all the records from the table.

What this tells us is the time taken is due to the fact that its going and getting all the table records no matter whatever is the situation we have. Now hitting DB and getting everything does call for some time although small but it till takes up time on the server.

Now lets do the same experiment but with Entity Data Source.

DataBinding with Entity Data Source:

I will use the same data grid but instead of SQL Data Source I will use a Entity Data Source. In order to work with Entity Data Source, you need a Entity Data Model. I will not get into how to create a Entity Data Model but assume that you know how to do it. Just create a ADO.NET Entity Data Model and generate the models from the database and use the same Northwind database. Once you have the ADO.NET Entity Data Model created, create a Entity Data Source on the page. Here is the Entity Data Source code snippet that I have:

 
<asp:EntityDataSource ID="EntityDataSource1" runat="server" 
                          OnContextCreating="EDS_ContextCreating" 
                          EntitySetName="Order_Details" />

I am making use of the OnContextCreating event to set the DbContext of ADO.NET Data Model to Entity Data Source ObjectContext. Here is the code for the event handler of OnContextCreating:

 
protected void EDS_ContextCreating(object sender, EntityDataSourceContextCreatingEventArgs e)
{
    var db = new NORTHWINDEntities();
    e.Context = (db as IObjectContextAdapter).ObjectContext;
}

Here NORTHWINDEntities is my Entity Data Model context. I am just casting it to ObjectContext since Entity Data Source works with ObjectContext. I set this entity data source as the data source of the RadGrid.

Analyzing the Queries:

Now lets run the app and trace SQL queries for the same set of actions we did with SQL Data Source control.

First, on page load:

SNAGHTML509e74c

Fig 7: Entity Data Source – Page Load – Query Trace

As you can see we have put in a “SELECT TOP 10” statement in the query. So its not bringing all 2155 records rather only 10 records. So time spent to do this will be very negligible. We also execute one additional query to get the total record count.

Now lets see what happens when we do a paging:

SNAGHTML50e4016

Fig 8: Entity Data Source – Paging – Query Trace

Now, lets trace the query when we do ‘’Add new record” scenario:

SNAGHTML50fd88d

Fig 9: Entity Data Source – Add New Record – Query Trace

Notice that, in this scenario, we automatically page to the last row and add a blank record.

As you can see from the above experiments, RadGrid is intelligent enough to optimize the queries based on the scenario you are dealing with.

Conclusion:

It was very evident from the experiments that if you are using SQL Data Source as your data source choice, there is not much RadGrid can do to optimize the query before it gets executed. Where as with Entity Data Source, RadGrid is smart enough to optimize the query and always have a optimized data fetch. I personally recommend using an ORM in the project for the data access scenarios and use the Entity Data Source as your data source choice. We i.e at Telerik have a free ORM called OpenAccess. Its free for life so you can pretty much use this in your production without any hassle at all. Do give it a try and let us know how you feel about it.

I hope this blog post does give you information on things you need to take care while doing data binding to Grids. This is just not in particular to RadGrid, this is mostly about any data binding scenario. Trace your queries and be sure that write and optimized queries are getting executed in your apps.

Till next time, Happy Coding.

Advertisement
RadControls for Silverlight

Silverlight RadCartesianChart: Reading data from WCF Service

Overview:

As part of evangelism job I speak to a lot of customer and try to tell them how they can use our controls. Couple of days back I was speaking one customer who was evaluating our RadControls for Silverlight suite and in particular was working with RadCartesianChart control. He saw all our demos of RadCartesianChart we ship and said that they all provide data from the code behind and are static in nature. They were looking for examples which tell them how to consume data from a WCF service and provide it to RadCartesianChart. So this blog post is all about how do we provide data to ChartView from a WCF Service. So lets get started.

Create RadControls Silverlight Application:

First thing to do, is to create a new project of type RadControls Silverlight Application. I am using Visual Studio 2012 for the rest of this blog post. You can do this in VS2010 too. Open Visual Studio IDE and select File > New Project. In the New Project dialog select Telerik > Silverlight > C# RadControls Silverlight Application. Give a name for the project and click ok.

SNAGHTMLf99013 Fig 1. New Project Dialog

Next, Visual Studio will ask you whether to host the SL app in a new web site and what should be the SL version. I am opting SL Version 5 for the sake of the demo. Here is the screenshot of the dialog:

SNAGHTMLfc02a3

Fig 2. Silverlight Application Settings Dialog

Since we have selected RadControls Silverlight Application, next you will get a “Project Configuration Wizard” where you will select the Components you require in your project. Since I am only interested in Charting, I will select only Telerik.Windows.Controls.Charting and the wizard automatically selects the dependent components for me. Here is the screenshot of the dialog:

SNAGHTML100ba2f

Fig 3: Telerik Project Configuration Wizard – Silverlight Settings Dialog

Clicking next will take you to theme settings. I am selecting Windows8 theme that comes out of the box. Click finish to let Visual Studio create the project.

SNAGHTML1023d24

Fig 4: Telerik Project Configuration Wizard – Theme Settings Dialog

Once Visual Studio finishes creating the project, here is how the solution will look like:

image

Fig 5: Solution Explorer

You can see that we have 2 projects in the solution. One is the actual Silverlight app and another is the Web app which will host the Silverlight XAP. Next we look at how to create a WCF service.

Create WCF Service:

For the sake of the demo, I will be creating a WCF service which does the following things:

  • Create a ProductModel which will act as a DataContract. It will have ProductID, Name and Price as properties
  • Create a WCF Service which will connect to Northwind Database.
  • Have one Operation called GetTop10ProductsByPrice.  This will execute a simple query to fetch top 10 products price wise and convert that into list of ProductModel and return it to client

Product Model Class:

We will create the WCF service in Web App project. We App will host our service too. Create a new folder called “Model” and create the ProductModel class. Here is the code for the ProductModel class:

[DataContract]
public class ProductModel
{
private int productID;
[DataMember]
public int ProductID
{
get { return productID; }
set { productID = value; }
}

private string productName;
[DataMember]
public string ProductName
{
get { return productName; }
set { productName = value; }
}

private decimal price;
[DataMember]
public decimal Price
{
get { return price; }
set { price = value; }
}
}

Chart Data WCF Service:

First create a folder and name it as Services. Right click on Services folder and select Add > New Item. In Add New Item dialog, select Silverlight from installed templates and then Silverlight-enabled WCF Service. Lets name the service as ChartDataService.svc. Click Add to create the service.

SNAGHTML185ec2a
Fig 6: Add New Item dialog

Next, since we need to connect to Northwind database, add a connection string to Web.config in the Web project. I have named my connection string as “NorthwindConnection”.

Next, in the ChartDataService, remove the generated operation contact with name “DoWork”. Instead add a new Operation and lets call it “GetTop10ProductsByPrice”. In this function we will connect to Northwind Database using SQL Connection and execute a simple query. We will loop through the data reader and generate a list of ProductModel and return the list. Here is the code for GetTop10ProductsByPrice operation:

[OperationContract]
        public IList GetTop10Products()
        {
            string nwConn = ConfigurationManager.ConnectionStrings["NorthwindConnection"].ConnectionString;
            var prodList = new List();
            using (SqlConnection conn = new SqlConnection(nwConn))
            {
                const string sql = @"SELECT TOP 10 ProductID, ProductName, UnitPrice
                                     FROM Products
                                     ORDER BY UnitPrice DESC";
                conn.Open();
                using (SqlCommand cmd = new SqlCommand(sql, conn))
                {
                    SqlDataReader dr = cmd.ExecuteReader(CommandBehavior.CloseConnection);
                    if (dr != null)
                        while (dr.Read())
                        {
                            var cust = new ProductModel
                            {
                                ProductID = dr.GetInt32(0),
                                ProductName = dr.GetString(1),
                                Price = dr.GetDecimal(2)
                            };
                            prodList.Add(cust);
                        }
                    return prodList;
                }
            }
        }

Consuming WCF Service from Silverlight App:

Now that we have a service, next thing to do is to reference that service in our Silverlight application. Right click on Silverlight application and select “Add Service Reference”. In the Add Service Reference window, click on Discover button. The WCF Service we created in the previous section will be automatically discovered and will list down the operation it supports.

SNAGHTML125209f

Fig 7: Add Service Reference Dialog

Now click on the Advanced button located in the bottom left side of the dialog to open the service reference settings dialog. In the Service Reference Settings dialog, under Reuse types in referenced assemblies, select the System related assemblies and not the Telerik ones. Here is a screenshot of the dialog:

SNAGHTML1290d1f
Fig 8: Service Reference Settings Dialog

Clicking Ok will add a service reference in Silverlight app which can be invoked at runtime to fetch the data required for the chart.

Add RadCartesianChart Control:

Next we need to add the ChartView control on the screen. In order to do this, Open MainPage.xaml, identify the ChartView control from the toolbox, drag and drop it on to the MainPage.XAML. Give the chart a name. Here is the code to CartesianChart markup:

<telerik:RadCartesianChart Grid.Row="1" 
                            x:Name="chartView" 
                            Palette="Metro">
    <telerik:RadCartesianChart.VerticalAxis>
        <telerik:LinearAxis Title="Price (USD)"/>
    </telerik:RadCartesianChart.VerticalAxis>
    <telerik:RadCartesianChart.HorizontalAxis>
        <telerik:CategoricalAxis Title="Products"/>
    </telerik:RadCartesianChart.HorizontalAxis>
    <telerik:RadCartesianChart.Series>
        <telerik:BarSeries x:Name="barSeries1" 
                            ItemsSource="{Binding}" 
                            ValueBinding="Price" 
                            CategoryBinding="ProductName" 
                            ShowLabels="True" />
    </telerik:RadCartesianChart.Series>
</telerik:RadCartesianChart>

Lets take a closer look at the code. I first define the vertical axis and tell the chart that it’s a linear axis. I also set title to the vertical axis and call it “Price (USD)” because my vertical axis will hold the price of products. Next, I define horizontal axis and and tell the chart that it’s a Categorical axis. My horizontal axis will be used to represent the product itself, so setting the title of horizontal axis as “Products”. Now that we have finished setting the axis only thing left now is to create a series. So I define Series and create a BarSeries. I have given a name for the bar series and will use this name in code behind to perform data binding. We need to provide the data to the series – so lets set the ItemsSource to the Binding it will get at runtime. Now we need to tell what fields corresponds to the value of the series and what corresponds to the category axis of the series. Set ValueBinding to “Price” field and CategoryBining to “ProductName”.

Data Binding:

We defined the UI part of the chart. Now to provide data to the chart. We had add a service reference to our WCF service earlier. So we will have a client class created in the Silverlight project and will be known as ChartServiceClient. So we will use this client class to invoke the “GetTop10Products” operation. Here is the code to invoke the service and bind the data received to the chart view:

void MainPage_Loaded(object sender, RoutedEventArgs e)
{
            ChartServiceClient client = new ChartServiceClient();
            client.GetTop10ProductsCompleted += client_GetTop10ProductsCompleted;
            client.GetTop10ProductsAsync();
}

void client_GetTop10ProductsCompleted(object sender, GetTop10ProductsCompletedEventArgs e)
{
            var data = e.Result;
            this.chartView.DataContext = data;
}

As you can see we invoke the operation asynchronously. When the operation completes we get the data and set it as the DataContext of the Chart. Run the application and when the page loads we should get the Chart as below:

image

As you can see we get our bar series graph which will show the price (in USD) on the vertical axis and products in the horizontal axis. We see the top 10 products by price.

Conclusion:

In this blog post, what I attempted was a very specific scenario which is most common on real world. As I said in the beginning, the customer I was talking to wanted to see an example of how to connect to a WCF Service, get data from the service and bind that data to Chart. So this blog posts outlines the steps required to make the chart work with WCF Service, Hope this is useful to many of you who may be having the same scenario. Do let me know your feedback if any.

Till next time – Happy Coding!