In this post we will take a look on working RadCharts in Windows Phone 8 Applications. I shall follow simplistic step by step approach for better learning of yours. At the end of this post we will complete creating a chart application as below.
Learn more Rad Controls for Windows Phone here
Step1: Create a Windows Phone 8 Application
Start with creating a Windows Phone 8 Application. To create Windows Phone Application choose Windows Phone App project template from Windows Phone tab.
Choose Windows Phone 0S 8.0 as Target Windows Phone OS version.
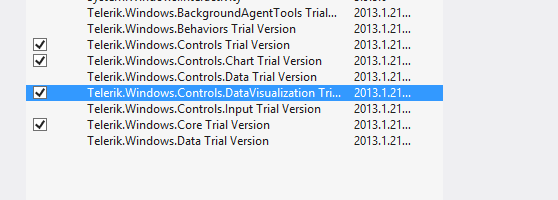
Next we need to add following references in the project to work with RadChart. To add references right click on the project and from context menu select Add Reference. After adding reference we are all set to work with RadCharts in Windows 8 project.
Step2: Add namespace on XAML
To work with chart now we need to add required references on XAML.
xmlns:chart="clr-namespace:Telerik.Windows.Controls;assembly=Telerik.Windows.Controls.Chart"
xmlns:chartEngine="clr-namespace:Telerik.Charting;assembly=Telerik.Windows.Controls.Chart"
After adding namespace we can put Chart on Xaml. A Chart can be created with following mark-up.
<chart:RadCartesianChart x:Name="chart">

 </chart:RadCartesianChart>
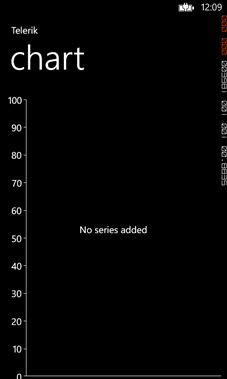
At this point if we go ahead and run application, we will find message that HorizontalAxis not set VerticalAxis not set.
Step3: Add VertialAxis and HorizontalAxis
Next step we need to add VerticalAxis and HorizontalAxis to chart. We can add axis as following,
<chart:RadCartesianChart x:Name="chart">
 <chart:RadCartesianChart.HorizontalAxis>
 <chart:CategoricalAxis/>
 </chart:RadCartesianChart.HorizontalAxis>
 <chart:RadCartesianChart.VerticalAxis>
 <chart:LinearAxis Maximum="100"/>
 </chart:RadCartesianChart.VerticalAxis>

</chart:RadCartesianChart>
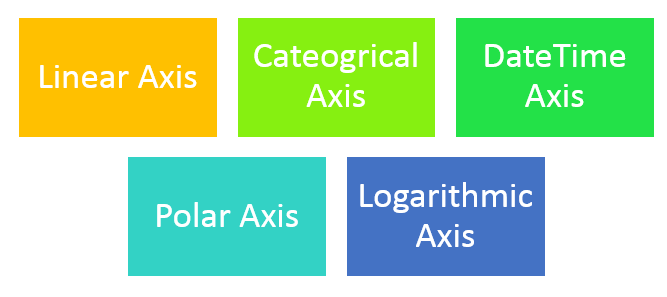
There are different kind of Axes available. We will not get into details of each type in this post. However different kind of axes are as follows,
We are using Linear Axis for Vertical Axis and Cateogrical Axis as Horizontle axis in this example. At on running application we will get chart with two axis. However there will be no data rendered on chart. We are getting message that No Series added.
Step 4: Add Series to the Chart
In this step we will add Series to chart. We can add series to chart as following ,
<chart:RadCartesianChart.Series>
 <chart:LineSeries Stroke="Orange" StrokeThickness="2"></chart:LineSeries>
 </chart:RadCartesianChart.Series>
Likely Axis there are different kind of series is also available . We will talk about different series in later post. However different kind of series is as follows
At this point if we run application we will get message that there is no datapoint added in the chart. We will get expected output as following ,
Step 4: Add Data Point to Chart
We can add Data Point as following in the chart. We are adding data point in XAML here. In real time scenario we will have to fetch data from services and bind data point to chart at runtime. We can achieve that using data binding.
<chart:RadCartesianChart.Series>
 <chart:LineSeries Stroke="Orange" StrokeThickness="2">
 <chart:LineSeries.DataPoints>
 <chartEngine:CategoricalDataPoint Value="20"/>
 <chartEngine:CategoricalDataPoint Value="40"/>
 <chartEngine:CategoricalDataPoint Value="35"/>
 <chartEngine:CategoricalDataPoint Value="40"/>
 <chartEngine:CategoricalDataPoint Value="30"/>
 <chartEngine:CategoricalDataPoint Value="50"/>
 </chart:LineSeries.DataPoints>
 </chart:LineSeries>
</chart:RadCartesianChart.Series>
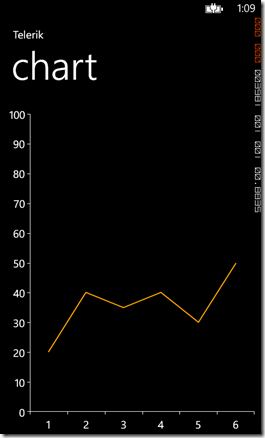
At this point on running application we should get chart as following,
If we want we can add one more series to Chart as following
<chart:RadCartesianChart.Series> <chart:LineSeries Stroke="Orange" StrokeThickness="2"> <chart:LineSeries.DataPoints> <chartEngine:CategoricalDataPoint Value="20"/> <chartEngine:CategoricalDataPoint Value="40"/> <chartEngine:CategoricalDataPoint Value="35"/> <chartEngine:CategoricalDataPoint Value="40"/> <chartEngine:CategoricalDataPoint Value="30"/> <chartEngine:CategoricalDataPoint Value="50"/> </chart:LineSeries.DataPoints> </chart:LineSeries> <chart:LineSeries Stroke="Red" StrokeThickness="2"> <chart:LineSeries.DataPoints> <chartEngine:CategoricalDataPoint Value="10"/> <chartEngine:CategoricalDataPoint Value="20"/> <chartEngine:CategoricalDataPoint Value="45"/> <chartEngine:CategoricalDataPoint Value="60"/> <chartEngine:CategoricalDataPoint Value="50"/> <chartEngine:CategoricalDataPoint Value="40"/> </chart:LineSeries.DataPoints> </chart:LineSeries>
After adding two series application should render Chart like following,
Step 5: Add Data Point to Chart from Code behind
In previous steps we added Data Points in XAML. We can very much add Data Points at run time. To add data point from code behind let us go ahead and delete data point from XAML. We can add that in code behind as following,
this.chart.Series[0].ItemsSource = new double[] { 20, 30, 50, 10, 60, 40, 20, 80 };
 this.chart.Series[1].ItemsSource = new double[] {10,30,40,60,34,59,20,75 };
In this way we can work with Charts in Windows Phone 8. I hope you find this post useful. Thanks for reading.
Follow @debug_mode


![clip_image002[5] clip_image002[5]](https://telerikhelper.net/wp-content/uploads/2013/03/clip_image0025_thumb.png?w=234&h=390)
Pingback: Step by Step working with Telerik Charts in Windows Phone 8
Great tutorial, Dhananjay. Thank you very much!
I think you forgot to mention that in code behind we got to add reference to telerik libraries as well