
Recently a customer was evaluating Kendo UI for one of their applications. Their team was using Angular JS as the UI framework. They wanted to know how to achieve a drill down on Kendo UI Chart with Angular JS. Now, Kendo UI has always supported Angular JS 1.x directive out of the box. Eventually i built a small demo on how to achieve this to showcase it to the customer. I thought why not turn this to a blog post and hence this post. I will be walk you through on how to create a drill down Kendo UI Chart with Angular JS 1.x. Lets get started.
Sneak Peek:
If you are looking for what we are building today, here is a GIF i created of the end result. I will be plotting a bar graph with 1 series which contains different categories. Each category when clicked will drill down to reveal more information.
Kendo UI Chart – Drill Down using Angular JS 1.X
Declaring Kendo UI Chart:
Lets take a look at the code first. I will explain the code step by step.
| <div id="example" ng-app="KendoDemos"> | |
| <div ng-controller="MyCtrl"> | |
| <div kendo-chart="kChart" | |
| k-series-defaults="{type:'column'}" | |
| k-series="[ | |
| {field:'value',categoryField:'category'} | |
| ]" | |
| k-data-source="chartDataSource" | |
| k-series-click="onSeriesClick" | |
| style="height:450px"> | |
| </div> | |
| </div> | |
| </div> | |
| <script> | |
| //code ... | |
| </script> |
- First we create a div and designate that as the ng application
- Then we have an inner div which will house the chart and we provide our ng controller to this div. i have named my controller as “MyCtrl”.
- Then we create a div and we use the Kendo UI Chart directive “kendo-chart” on it. This directive will convert the div to Kendo UI Chart at run time.
- We then set series default of the chart, series that will be used for the current chart, the data source to look up on the scope and the event handler reference on the scope whenever a series is clicked
All we have done so far is to just set up the markup for the chart. Next up we will see the code that will power the grid.
Angular Controller Code for the Kendo UI Chart:
First up we will create the angular module and add our angular module to it. Here is the code snippet:
| angular.module("KendoDemos",["kendo.directives"]) | |
| .controller("MyCtrl", function($scope){ | |
| //code ... | |
| }); |
Next i will define the data required for the chart on the scope as variables. I will use an initial chart data and then the data for each drill down category. Here is the code snippet:
| $scope.initialData = [ | |
| {category:"MSIE",value:55.11}, | |
| {category:"Firefox",value:21.63}, | |
| {category:"Chrome",value:11.94}, | |
| {category:"Safari",value:7.15}, | |
| {category:"Opera",value:2.14}, | |
| ]; | |
| $scope.msieData = [ | |
| {category:"MSIE 6.0",value:10.85}, | |
| {category:"MSIE 7.0",value:7.35}, | |
| {category:"MSIE 8.0",value:33.06}, | |
| {category:"MSIE 9.0",value:2.81}, | |
| ]; | |
| //other category data |
Next we create a data source for the chart. We use Kendo UI DataSource as the chart data source. We will provide the initial chart data array that we have created as the initial data for the chart. Note: in this demo i am using static data to showcase the drill down example. But the Kendo UI Data Source can be bound to a remote end point to fetch the data.
| $scope.chartDataSource = new kendo.data.DataSource({ | |
| data:$scope.initialData | |
| }); |
Now if you run the application you will get the chart initialized with the initial data we have provided. Here is the snap shot of the chart output:
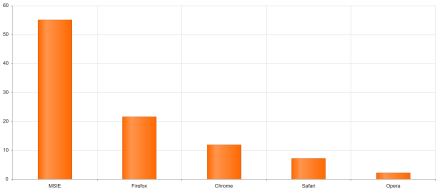
Kendo UI Chart with Angular
Handling Series Click on the Kendo UI Chart:
In the Kendo UI Chart declaration we have already hooked up the series click event to be handled by a event handler. So all that is left now is to add the function which will do that. Here is the code snippet which will handle the series click event of the chart:
| $scope.onSeriesClick = function(e){ | |
| var categorySelected = e.category; | |
| if(categorySelected === "MSIE") | |
| { | |
| $scope.chartDataSource.data($scope.msieData); | |
| } | |
| else if(categorySelected === "Firefox") | |
| { | |
| $scope.chartDataSource.data($scope.ffData); | |
| } | |
| else if(categorySelected === "Chrome") | |
| { | |
| $scope.chartDataSource.data($scope.chromeData); | |
| } | |
| else if(categorySelected === "Safari") | |
| { | |
| $scope.chartDataSource.data($scope.safariData); | |
| } | |
| else if(categorySelected === "Opera") | |
| { | |
| $scope.chartDataSource.data($scope.operaData); | |
| } | |
| else | |
| { | |
| $scope.chartDataSource.data($scope.initialData); | |
| } | |
| }; |
All we are doing is, when a series category is clicked we capture the category. Then get the drill down data for that category and set it to the Kendo UI data source we have created on the scope. The chart will be automatically re-rendered as soon as the data is changed. So we have in a way achieved the drill down behavior on the chart itself. Its as easy as that.
This blog post was all about showcasing how easy it is to handle a drill down in Kendo UI Chart if you are using Angular JS as your UI framework. The complete solution is available as Kendo UI DOJO here: http://dojo.telerik.com/@kashyapa/UWEnO
Hope you like this blog post. If you have any feedback/suggestions – do let us know through your comments below.

Pingback: How to: Drill Down Kendo UI Chart using Angular JS 1.X – AngularJS News