Let us assume that you are doing automated test of login functionality. While executing the test you want to encrypt the Password information provided by the user to authenticate. Test Studio allows you to encrypt the vital information in the test steps.
Suppose you have recorded a login test as following. If you see in step 4 password is displayed in the plain text.
If you want to encrypt this information select the step and open the property. Open the property window for enter password step and navigate to Behavior tab. At the top of property window you can verify that for which step property is open. You see that Encrypt behavior value is set to false.
To encrypt the password you need to change value of Encrypt to true.
After changing this value when you navigate back to test steps, you will find password has been encrypted
So in this way you can encrypt vital information while executing the test. I hope you find this post useful. Thanks for reading.
In this post we will see, “How could we submit a bug from Test Studio to TeamPulse?“
Let us assume that we executed an automated functional test and we got the following result. Step 6 in the test failed.
We need to submit this bug to Team Pulse. To submit bug to Team Pulse double click on Red Cross and you will get Step Failure Details dialog box as shown in following image.
Click on the Submit Bug. If Team Pulse is not configured then you will get dialog box to set up Team Pulse. In this dialog box click on Set this up now
If you have already configured TeamPulse or TFS in any of the other Test Project then Test Studio remember that and prompt you that whether you want to import previous setting or you want to go with New Setup. Let us go ahead with New Setup for that click on New Setup.
After clicking on New Setup now you will get below dialog box. Select TeamPulse Server and click on Configure Selected.
In next dialog box, provide
Url of TeamPulse
Username and Password to authenticate to Team Pulse.
After providing credential you need to click on the Connect button. After successful authentication you will get Project to select. Select Project, Severity and Status from drop down. At last click on Done button.
If you have successful connected to Team Pulse, you will get Green Right icon next to TeamPulse. Check on check box to make it default and click on Donebutton.
Next you will be prompted to dialog box to submit the bug.
Before submitting bug, you can Edit Title and Description of the Bug. If you want to submit files related to Failure details then check the check box Attach Failure details. To submit the bug, click on Submit button.
You will get successful message on successful submission of bug from Test Studio to TeamPulse
In this way you can submit bug to TeamPulse from Test Studio. I hope you find this post useful. Thanks for reading
I would like to thank everyone for attending webinar on “Performance and Load Testing with Test Studio”. Please find below answers of the questions come up in the webinar.
How to encrypt the password and please can you show us how to handle the parameterization?
Password encryption is set via the property panel for that test step.
Can we do Performance test & Load test with third party application that do not run through browser
Test Studio support web applications. Other applications are not supported.
Test Studio is only for .NET testing not for the JAVA or other testing. Can it test standalone java application?
Test Studio will test any web, Silverlight, or WPF application. The web application can be written on any platform. Java, Ruby, .NET, Python, PHP, it doesn’t matter as long as HTML is sent across the wire.
How many computers we can select at one shot during performance testing
We support multiple computers. We’ve tested with large configurations.
Can we have test suites for the performance testing?
Yes. Test Lists may be created which focus on performance tests.
Can we have custom performance counters added?
Custom counters will be available if they are added through the Windows Performance counter infrastructure.
Describe how to identify the memory leakage using Telerik Test Studio
Memory leakage would be monitored by using performance monitor counters for memory usage. (Total available bytes, garbage collection, etc.)
What criteria would you use to select Web transactions for load testing?
If by “transactions” you mean use cases, then you want to select as many different ones as possible in order to model your site’s traffic as accurately as possible.
How to use Regular Expression in Load Runner for web functions
This webinar is about Telerik’s Test Studio. Please see HP for questions about Load Runner.
Can do the Regression Testing also by using Test Studio
Yes. Automated tests are perfect for regression testing.
In this post we will learn different Transition Styles between Kendo UI Mobile Views.
To start with let us assume we have an application as following. This application consists of two views. On click of Kendo button, user will navigate to Other View.
There are four supported Transition styles, they are as follows
Overlay transition style
See the video for the behavior of Overlay transition style
Slide transition style
See the video for the behavior of Slide transition style
Zoom transition style
See the video for the behavior of Zoom transition style
Fade transition style
See the video for the behavior of Fade transition style
Default transition style is “slide”. We can apply transition style in three ways
At the application level
At the view level
At the control level
At Application Level
When set at application level same transition style will be applied to entire application. All views of the application will adhere to the same transition style. At application level transition style can be set by providing value of transition property in Kendo mobile initialization.
At View Level
Other option to set transition style is at view level. On navigating to this view user will experience transition style set at the view.
At Control Level
We can set transition style at control level as well. In following case we are applying transition style to a kendo button. User will experience zoom transition behavior while navigating to view set in the href property of the keno button.
If transition style is set at all the three levels then Control level has highest priority whereas application level has lowest priority.
In this way you can apply different transition style to the application. For your reference find the source code of above discussed application below.
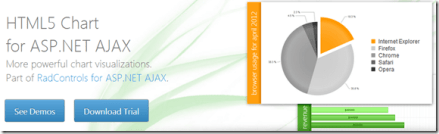
In this post we will try to see how to work with a RadHtmlChart. We will go step by step in creating and using the RadHtmlChart in a web page. I will try to outline each piece that make up an RadHtmlChart and how to work with them. So if you are in need of using a RadHtmlChart in your pages, read through the following sections and follow along.
Pre-Requisite:
In order to follow along this blog post, you will need to have downloaded the RadControls for ASP.NET AJAX suite and installed it on your development machine/laptop. Here is the download link to RadControls for ASP.NET AJAX Suite:
Create a Web Site Project:
First and foremost thing to do is to create a Web Site which will be our playground for this blog post. Once you install the RadControls for ASP.NET AJAX you will see Telerik project templates in Visual Studio New Project dialog. For this blog post I will be creating a “C# RadControls Web Site” project. Give it a name and keep the default settings in all of the dialog that comes up.
Adding RadHtmlChart to a page:
The RadControls Web Site project template when finishes the web site creation, will create a single web page namely Default.aspx. For the sake of simplicity I will just use this page to create the chart. There are two ways to add the chart on to the web page. First, you can drag it from the Toolbox on to the source. Secondly you can just type the tag on the source.
So I am going to type out the tag name and create the chart. Here is the code to instantiate the RadHtmlChart on a web page:
We can instantiate the RadHtmlChart from the telerik namespace. If you look at the web.config the telerik tagprefix is configured to be available on all the pages. Here is the code snippet:
So if you now view the web page, you will see the following output:
As you can see from the output, we get the a base for the chart. Now that we have a base, we will build up the chart one by one.
Chart Appearance:
Now that we have a chart coming up, lets give some facelift to the chart. We can control the appearance of the chart i.e. we can provide a background color to the chart. The RadHtmlChart provides Appearance property through which we can set the background color. The Appearance contains FillStyle property which exposes BackgroundColor attribute and we set the color to this attribute. Here is the code snippet:
I have set LightGray as the background color of the chart. If we now run the application and check the output, you will see the chart as below:
Chart Title:
Next thing to do is to set the chart title. For setting the title, chart exposes ChartTitle property. ChartTitle contains a text Property and you can provide the text you want to see on the chart. The appearance of the chart title can be configured through Appearance property of the chart title. Here is the code snippet:
<ChartTitle Text="Server CPU Load By Days">
    <Appearance Align="Center" BackgroundColor="White" Position="Top" />
</ChartTitle>
Here is the snapshot of the chart after setting the title:
As you can see we have set the text and appearance of the title. Next we will take care of the legend.
Legend Appearance Settings:
Legend is nothing but a way to let the end user know what series belong to what context. So the way to style a legend is through Appearance property of Legend object. The appearance allows us to set the background color and position of the legend. Here is the code snippet for the same:
After adding the legend tag we cant see its effect immediately on the chart. That is because this comes into effect only when we provide the Y Axis items i.e. the main data points of the chart.
Plotarea Settings:
The plot area as the name goes is the area where the chart actually gets plotted. So We have the following options to play with respect to the play area:
Plotarea Appearance Settings
Plotarea X Axis Settings
Plotarea Y Axis Settings
Plotarea Series Settings
Lets look at the above points one by one.
Plotarea Appearance Settings:
The appearance of the plot area can be changed with Appearance property. Appearance property supports FillStyle child property where we can set the background color of the plot area. Here is the code snippet for the same:
So far we have just prepared the chart area and the plot area. We haven’t yet defined any axis related information on the chart. The X Axis settings are set as a child element of Plotarea object. Let me show you the code snippet of the same and explain the different attributes that make up the X Axis setting. Here is the code snippet:
On the XAxis we can first set the Color of the X Axis line. I have set it to Black; this can be of any color. Then MajorTickType is the type of the ticks that mark the major grid lines and values can be None of Outside. Similarly MinorTickType is the type of the ticks that mark the minor grid lines and this can be either None or Outside. Reversed is a setting which is used to determine if the axis will be reversed i.e. low value in place of high value and vice versa. I have set it to false. Next I have given the items that make up the x axis. The Items collection takes a AxisItem object which conatins an attribute named Labeltext. So in my example I am setting the x axis to week day names.
Also notice that we have ability to configure the LabelsAppearance i.e. the x axis labels appearance. You can format the label text and also rotate the label using the RotationAngle attribute. The MajorGridLines allows us to configure the color and width of the major grid line and similarly the MinorGridLines property. We can also provide a title to the x axis and is done so by setting the TitleAppearance property. You can position the title through Position attribute or rotate the title using the RotationAngle and also the title text through Text attribute. In my example I have given the text as Days. Here is the output of the above code configuration:
Plotarea Y Axis Settings:
Similar to X axis setting the Y axis also can be configured and pretty much the same attribute structure is used. Here is the Y Axis setting I have done for my example. Take a look at the code snippet and I will explain the code in a moment:
First, the Y axis setting is done on YAxis object of the RadHtmlChart. Pretty similar to X axis, we have the Color attribute of the Y axis line which can be configured. Then we set the MajorTickSize and MajorTickType. Similarly the MinorTickSize and MinorTickType is also set. The Min and Max value to be represented on the the Y Axis is set. We also can tell the increments in which the ticks have to be drawn through the Step attribute.
We can configure the Y axis labels through LabelsAppearance property. The MajorGridLines and MinorGridLines properties let us configure the color and width of the grid lines. The title of the Y axis is set through TitleAppearance property. Here is the output of the chart with the settings done so far:
Plotarea Series Settings:
So far we have set up the X & Y axis and configured them with respect to the axis title, major and minor grid lines. The main heart of the chart is the Series collection that Plotarea contains. Series collection is the property on which we define what kind of chart series we would like to plot. It can be a BarSeries or ColumnSeries or LineSeries etc etc. In this example I will be considering a simple example of Bar chart so we will see how to define a BarSeries.
We will need to add BarSeries object to Series collection. The BarSeries can be given a name using attribute Name. Then the actual values of the data points can be added to Items collection of BarSeries. The type of item to add is SeriesItem and it contains a attribute named YValue which needs to be filled with the data value. This is the data point which will be plotted on the chart. We can customize the labels and the tool tip of the bar series. Here is the code snippet for the same:
with the above code here is how our chart looks like now:
Notice that the axis have been shifted automatically because the series we said to plot was a BarSeries and Bar is always plotted as a horizontal line. Also notice the appearance of the legend at the bottom. This is because as soon as we provided a series with a name, the name of the series becomes the legend text.
What if I want to add another series to the chart. Simple, just add another BarSeries to the Series collection and the chart will pick up the second series and plot it along with the first one. Here is the snapshot of the same chart after I added another series:
One of the cool features of RadHtmlChart is the fact that it will render the chart as a SVG on modern browsers and as a VML on older browser. So here is a screenshot of the same chart zoomed in at around 200%. Check out the clarity of the various chart details:
Here is the entire source code of the RadHtmlChart we have done so far:
This file contains hidden or bidirectional Unicode text that may be interpreted or compiled differently than what appears below. To review, open the file in an editor that reveals hidden Unicode characters.
Learn more about bidirectional Unicode characters
In this blog post I attempted to construct a RadHtmlChart piece by piece and show how easy it is to configure different aspects of the RadHtmlChart control. Things to take care are the Chart Appearance, Chart Title, Legend and Plotarea. Hope this gives you all a jump start in to working with the RadHtmlChart.
Note:
It is not necessary to hand code all of the above mentioned configuration settings. RadHtmlChart control has a rich visual designer support. Using that with couple of clicks you can easily set all the above talked configuration settings on a GUI. I will be writing a separate blog post on this.
The appearance of the chart and other aspects of the chart need not be set explicitly by choosing color which configuring rather RadHtmlChart ships with default 19 skins and you can just set the skin on the RadHtmlChart and that will take care of the color aspect in the chart. I will be covering this in a separate blog post.
The items for the series need not be hard coded as shown in this blog post. This was just an attempt to show that how things work. The RadHtmlChart supports 9 types of data sources and the chart can be bound to any of those data source. That way the items of the Y Axis will be bound at run time from the data source. I will be covering this in a future blog post
Performance Testing is being performed to measure smoothness and readiness of the application. While creating an application the vital factors should be kept in mind are as follows
Speed of the application at any given condition
Response time of the application
How much resources being used by the application
How stable is the application at given time
Throughput of the application
For web application times spent in making HTTP calls at server and client etc.
Performance Testing is type of testing that test application on above listed criteria.
Performance Testing measures performance of the application. After measuring performance of the application it sets the base line for further testing. Performance testing is very important since cooperate prestige of the application or decision on the final release of application based on the analysis of the results produced by this test. Performance testing does not find any defect in the application. Often, we perform Performance testing on a stable system.
Performance Test finds performance issue in the
Database access
Network latency like time spent on the network
Time spent on reading or writing files on the disc
Time spent on making HTTP calls etc.
So we can summarize Performance testing
Load Testing
Load Testing determines user experience when application is under load. In Load Testing, we test application with maximum number of users or with the expected number of users in the production environment.
Load Testing determines upper limit of the application. Load testing simulates expected number of users from the production environment and tests the application with that number of users. When we exceed number of users to test the application much beyond expected number of users from production environment then we call testing as STRESS TESTING. In majority of the time we consider Stress Testing as Load Testing.
Purpose of Load Testing is to find defect in the application when application is running under maximum load. Some of the defects could be as follows
Memory leak
Buffer Overflow
Server failure
Network failure
Input devices reading failure
Writing on output device failure etc.
We can summarize that Load Testing tests application behavior and sustainability with the maximum number of user inputs.
I was trying to execute a functional test in Firefox browser. For that I selected FF and clicked on Run to execute the functional test in Firefox browser.
However while executing the test, I got this message and Test Studio was kept waiting for the browser to respond.
After investigation I found that in Add-ons of Firefox, Telerik Testing Framework Add-ons was not enabled.
Make sure to enable both the Add-ons and you will be able to execute the function test in Firefox.
After enabling that you should able to execute a function test in Firefox browser.
In this post we will follow step by step approach to setup environment for Load Testing in Test Studio. Very first go to Program ->Telerik ->Test Execution and open Configure Load Test Services
Next you will get dialog box to configure the services.
In this dialog box you need to make sure that all the services are started and most importantly make sure that you have given correct database instance name in the Reporter Database Connection setting
In above case kumar is the database server name running on my machine. So I provided instance name kumar\sqlexpress. You do not need to create TestStudioReportingDB database manually. Test Studio will create this database in given database server. After making sure all the information is provided correctly click on Ok to restart all the services.
Next open Test Studio and create a test of type Load Test. Very first you will get following screen
Click on Okay and from the ribbon click on Manage
Here you got an option to Add Controller and manage the number of Virtual users. To Add Controller click on Add Controller button
In Add Controller dialog box give the name of the computer or IP of the computer you want to set as controller and click on Test Connection. After successful connection click on the Add button to add a controller
On the successful adding of controller you need to set the number of Virtual Users for the Controller as following. We have added 258 virtual users in this controller
Next we need to set Controller and Reporter. Select the computer from drop down and click on the connect button.
After successful connect you can see green signals beside Controllers, Reporters and Agents.
All three green signals imply that environment for load testing in Test Studio has setup successfully. Now you can go to design and create ass cases to perform Load Testing
In previous blog post, we looked at the element structure that makes up a RadHtmlChart. Now that was more from a client side i.e. a visual structure of what makes the chart. In this blog post we will take a look at what makes up the RadHtmlChart API i.e. the server side hierarchy.
Server Side API:
Pretty much all the Telerik RadControls enable you to customize them according to your needs & wants and so does RadHtmlChart. RadHtmlChart allows you to perform detailed customizations when you use it. Being a Service Side control, it offers a large set of properties. A deep hierarchy exist among these properties and it is this hierarchy that makes it possible to organize the control.
Visual Hierarchy:
Below diagram depicts the visual hierarchy of properties that RadHtmlChart control supports. You can keep this diagram handy and keep it as a reference when you want to set a particular property in the markup.
When you want to customize something in the RadHtmlChart you should pay attention to the inner most tags and their properties. For e.g. in order to customize the Appearance of a RadHtmlChart – You will be customizing the Appearance property and specifically the FillStyle child property that Appearance contains.
Conclusion:
Knowing a controls hierarchy visually helps us to understand how it is organized. And also it becomes easy when we want to customize the control according to our needs and wants. Through this blog post I hope I was able to make you understand the RadHtmlChart control hierarchy.
Thank you so much for attending Webinar: Telerik Tools for Ninja Developers: RadControls fot Windows Phone . I hope it was useful. If you have not done it yet then I strongly recommend you to download free trial and start playing around Rad Controls for Windows Phone. You will find more resources at below given links
If you need more information and any assistance then please feel free to get connected with me at @debug_mode or send me mail on Dhananjay.kumar@telerik.com . Thanks once again for attending the webinar.
Telerik has been working hard to help you in “DELIVERING MORE THAN EXPECTED “. Due to our work and love, we manage to create a semantic and purposeful relationship between you and us. Whether you are a developer, tester, IT pro or a manger our products help you to perform your task more effectively and quickly. We have products for all steps of development process. We are committed to make our products better in order to serve you better.
Today we have come to you with a request. If you love and appreciate our products then please vote for us. Vote for us in DevPro and ITPro community choice award. Our products are nominated in 25 different categories. Find details about award at links given below,