Revamping Web Applications: Software Architecture

Read part one- Revamping Web Applications Part-1 Overview

Read part two- Revamping Web Applications Part-2 Features

We have talked about the Event Networking web application. To start revamping we need to understand the architecture of the existing web application.The current implementation does not follow any architectural patterns like Separation of Concerns, Single Responsibility, Layered approach etc. No planning was done before building the application. We can say that top down approach was followed to develop the current web application. Top down means that the features were added as and when the developer thought it was required. The current application is like a forest of tangled codes.

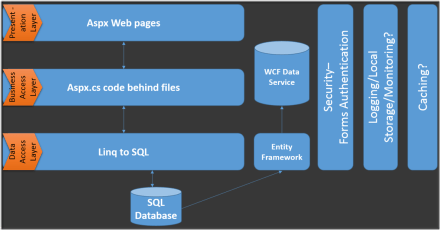
The current architecture of the application is shown below. The architecture may look like 3 tier in the beginning but really is a 2 tier due to the absence of the Business Objects.

clip_image002[5]

The layers are defines as follows:

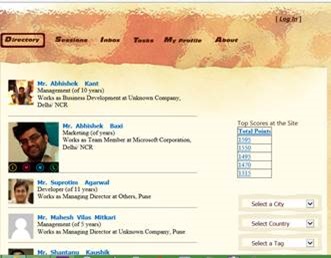
1. Presentation Layer: A user can directly access this layer. It comprises of the ASP.Net Web Forms files i.e. aspx. The look and feel and user interface of the web application is also built here.

2. Business Access Layer: BAL encapsulates the business rules and data validation. All the code behind files which we have in our project along with the WCF Data Service are included in this layer. It comprises of the aspx.cs files.

3. Data Access Layer: DAL is the layer to access external data and interact with it. It executes as per the need of the BAL. This layer is the interface between the user and the real Data. The ORMs here include Entity Framework and Linq to SQL.

4. Data: The last layer represents the physical data with which the application interacts. We use SQL Database here. Both Linq and Entity Framework stores and retrieves the data from SQL.

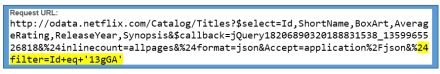
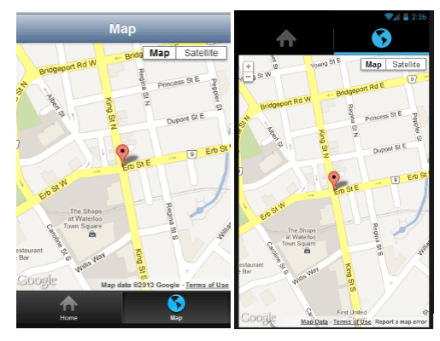
A distinguishing feature of the application is the presence of the WCF Data Service. The Data Service serves to expose the application data to external clients e.g. mobile devices. The Data Service is a read only service and operates independently of the web application. However, it still uses the same database for its data.

The web application doesn’t have the critical functionality of logging, local storage, monitoring and caching.

Conclusion

In this post we have understood the existing architecture. Next, we will perform a web test and discuss various counters and results of the test.

Read- Revamping Web Applications Part-4 : Performance Test

Step by Step Creating WCF Data Service using Telerik Open Access ORM

In this post we will learn step by step to create WCF Data Service using Telerik Open Access ORM. We will create data model of data from SQL Server and further exposed that as WCF Data Service using Telerik Open Access ORM.

Learn more about Open Access ORM here

We are going to follow step by step approach. To create WCF Data Service follow the steps given below,

Step 1: Create Telerik Web Access Web Application project

After installation of Telerik Open Access ORM you will get Telerik Web Access Web Application project template while creating a new project. Go ahead and create a project selecting Telerik Web Access Web Application project template from Web group

image

Step 2: Create Domain Model

Next you will be prompted to create Domain Model. Open Access ORM allows you to create domain model from any of the following type of database. If required you can create Empty Domain Model as well.

image

Let us go ahead and create data model from Microsoft SQL Server. Choose Microsoft SQL Server from drop down and click on the Next.

Step 3: Setup Database connection

In this step you need to set up Database connection. Either you can provide Connection String manually or can create a New Connection. To create new connection click on Add New Connection. You will get window to add new connection. In this window provide database server name and choose database from the dropdown. To test the connection click on Test Connection and after successful testing click on Ok to add a new connection.

image

Step 4: Setup Database Connection

In this step you need to setup database connection. If you want you can change connection string name. Let us leave it to default and click on the Next.

Step 5: Choose Database Items

In this step you need to choose

  • Schemas
  • Tables
  • Views
  • Stored Procedure to create data model.

Let us say we are choosing only one table to create data model. After choosing items click on the next .

image


Step 6: Define Naming Rules

In this step you can define naming rules of Classes, Fields and Properties if required. Let us leave to default and click on next to proceed further

Step 7: Code Generation Settings

In this step you can configure Code Generation Settings. Let us leave settings to default and click on Finish to generate data model.

Once Data Model is created you will find *.rlinq file added in the project. Click on *.rlinq file to view the data model.

image

Step 8: Add Open Access Service

By step 7 you have created data model. Now let us go ahead and add WCF Data Service on the created Data Model. For this right click on the project and select Add Open Acccess Service. You will be prompted with Add Open Access Service Wizard. Before adding Open Access Service make sure that once you have built the project.

You need to choose

  • Context : Select Context from the drop down
  • Project : Use the existing project

image

Click on the Next after selecting Context and Project.

Step 9: Select Service Type

In this step you need to choose type of Service you want to create. Since we want to create WCF Data Service, let us choose that from the option and click on the next.

image

Step 10: Choose Entity to expose a part of the Service

In this step we need to choose entity to expose as part of service. Since there is only one entity choose that and click on the Next

image

In last step you can preview various References being added and changes to config files. Click on Finish to create Service. After WCF Data Service being created you can test that in browser. Run the application and browse to *.svc to test the service in browser.

You should get data of People in browser as below after successful creation of the service.

image

Conclusion

In this post we learnt to create WCF Data Service using Open Access ORM. I hope you find this post useful. Thanks for reading.

How to apply filter in creating Kendo UI Data Source from OData

I was working on an application and there was a requirement in which I had to apply filter while fetching data from the server using ODATA. I had two choice to achieve this

  1. Construct ODATA URL with filter applied
  2. Apply filter in Kendo UI Data Source

In this post we will discuss how we could apply filter while creating Kendo UI DataSource reading OData feed.

We can create data source reading ODATA feed as following. Below we are creating data source reading ODATA feed of Netflix


var movieTitleData;
movieTitleData = new kendo.data.DataSource(
{
type: "odata",
endlessScroll: true,
batch: false,
transport: {
read: {
url: "http://odata.netflix.com/Catalog/Titles?$select=Id,ShortName,BoxArt&$top=10",
dataType: "jsonp",

data: {
Accept: "application/json"
}
}
}

});

On inspecting request URL you will find that URL to fetch data is getting constructed as following. We are fetching top 10 movies title from Netflix

image

Now assume there is a requirement to fetch information of a particular movie with given Id. We can do that by applying filter while creating the KendoUI DataSource. We can apply filter to fetch movie of particular id as given below.

image

While applying filter we need to make sure that serverFiltering is set to true.

image

In Filter,

  1. Id is the column on which filter is being applied
  2. eq is operator to apply filter
  3. value is filter value

Kendo UI data source with filter applied can be created as following.


var moviedetailData = new kendo.data.DataSource(
{
type: "odata",
endlessScroll: true,
serverFiltering: true,
transport: {
read: {
url: "http://odata.netflix.com/Catalog/Titles?$select=Id,ShortName,BoxArt,AverageRating,ReleaseYear,Synopsis",
dataType: "jsonp",

data: {
Accept: "application/json"
}

}
},
filter: { filters: [{ field: "Id", operator: "eq", value: query }] }

});

While creating above KendoUI data source

  1. Data is fetched from Odata feed of Netflix
  2. Filter is applied on Id column of Netflix data source
  3. To apply filter at server side serverFiltering attribute is set to true

On inspecting request URL you will find that URL to fetch selected movie is getting constructed as following. We are fetching a particular movie on given id of the movie.

image

You will find that URL being constructed to fetch Odata feed is containing the filter query. In this way we can apply filter while creating Kendo UI DataSource reading an OData feed. I hope you find this post useful. Thanks for reading.

Revamping Web Applications Part-2

Read part one here – Revamping Web Applications Part-1

The web application we have chosen is about social networking at events.

This post briefs about the existing features of the application.

clip_image002

1. Directory– Displays all members attending a particular event
2. Sessions- Displays various event-schedules and their track
3. Inbox- Displays messages and request you receive
4. Tasks- Displays all the tasks
5. My Profile- Displays personal information

Directory

clip_image004

All the delegates registered are visible in a list form. A specific genre of audience can be filtered on the basis of different parameters such as City, Country, Tag, Designation, Company, Role and experience.

You can view the profile of a delegate and connect to them. In their public profile you could see job description and links to their various social networks. Once you are connected to another delegate you will also have the privilege to see their personal details.

The web application has a feature of social gaming and the top five scorers are displayed on the home screen.

Sessions

clip_image006

All the events/talks/workshops along with their date, time, venue and track are shown. Further information about speakers and other attendees can be viewed based on individual talks.

You can explore an event and add it to your personal list of event. There is a sub-tab “Cart” under sessions’ tab which displays the events you have registered for. The Cart would help notify the attendees about last minute changes or pre-requirements for the event (if any).

Inbox

clip_image008

Other than receiving text-messages you interact with other delegates by sending meeting requests. Other types also include contact request.

The person can view sent items along with the timestamp if needed.

Tasks

clip_image010

The tasks are meant to create a list of jobs or reminders for self. A task can be categorised with options like task created, completed, cancelled or deferred. Task url specifies the micro formats.

My Profile

A person can view and update his profile. The profile includes name, DOB, address, designation, years of experience, personal contact details. You can change your account password. Set your url feeds for your blogs and social networking websites to connect with delegates.

clip_image012

You can also define tags which would help delegates find you easily based on various technologies. image

Conclusion

In this post we have discussed on the key features of the application. Next we are going to elaborate on the testing results and its architecture.

Read – Revamping Web Applications Part-3 Software Architecture

How to show current location on Google Map in Icenium

In this post we will take a look on working with Google map in Icenium. We will display Google map pinned with current location in a mobile view.

image

On creating Cross-Platform mobile application (Kendo UI Mobile) in Icenium, you will find by default references to work with Google map added in the project.

clip_image002

Next we need to create a view. In this view map will be rendered,


<div data-role="view" id="map" data-title="Map" data-show="showMap" data-stretch="true">
<div>
<div id="map_canvas" style="width: 100%; height: 100%; position: absolute;">
</div>

</div>
</div>

There are certain points worth discussing about the view.

  • showMap function will be called whenever user is navigating to view.
  • Style of map-canvas div is set to 100% width and height such that map will be displayed in whole view.

Now we need to write showMap function. In this function we will call PhoneGap navigatior.geolocation.getCurrentPosition function to get the longitude and latitude of current location of the user.


function showMap() {

navigator.geolocation.getCurrentPosition(
onSuccessShowMap,
onErrorShowMap
);

}

navigatior.geolocation.getCurrentPosition will call onSuccessShowMap function on success and onErrorShowMap on any exception in finding users current location. In onSuccessShowMap function we will render Google map in the view created previously.

Rendering of Google map can be done in three steps,

Very first we need to find longitude and latitude of the current location and that can be done as following,

image

Once longitude and latitude has been determined next we want to create the map option. You can read more about Google map options in Google map API documentation. So we are creating map option as following,

image

After creating map option we need to create the map. It takes two parameters. First HTML element on which you want to render the map and then map options. We have created a div with id map-canvas in map mobile view to render the map and in previous step, we created the map option.

image

At the last step we need to set the marker on the map with the current location. That can be done as following,

image

To render map you need to consolidate all the steps discussed above in onSuccessShowMap(position) function. After consolidating function should look like below,


function onSuccessShowMap(position) {

var latlng = new google.maps.LatLng(
position.coords.latitude,
position.coords.longitude);

var mapOptions = {

sensor: true,
center: latlng,
panControl: false,
zoomControl: true,
zoom: 16,
mapTypeId: google.maps.MapTypeId.ROADMAP,
streetViewControl: false,
mapTypeControl: true,

};

var map = new google.maps.Map(
document.getElementById('map_canvas'),
mapOptions
);

var marker = new google.maps.Marker({
position: latlng,
map: map
});
console.log(marker);
console.log("map rendering");
}
</script>

In last we need to write onErrorShowMap function. In this function handle all the errors may encounter while reading current location of the user. I am leaving function like following


function onErrorShowMap(error) {

alert("error");
}

Now when you run application you should get map with user current location in the map view.

image

I hope you find this post useful. Thank for reading.

Few Queries on Test Studio : Answered

Recently I was giving demo on Test Studio. While demo there were few questions popped up . In this blog I am consolidating those questions such that it would be useful for all Test Studio users.

image

Does it work with Telerik SL CONTROLS

Yes Test Studio support SL controls. For demo, please see Telerik TV and look at the videos listed under the Silverlight tag:

http://tv.telerik.com/products/automated-testing-tools?FilterByTags=Silverlight

How would it integrate into a CI ENVIRONMENT

You can find more details about CI integration at

http://www.telerik.com/automated-testing-tools/support/documentation/user-guide/command-line-test-execution.aspx

How Test Studio works with MS LAB

We don’t have anything specific with how we integrate with the TFS/VS lab environment.

How does it run tests? Does it require agents to installed

If you want the tests run via the scheduler or remotely then you do need an agent installed. You can find more details here

http://www.telerik.com/automated-testing-tools/support/documentation/user-guide/scheduling-test-runs.aspx

Does it support SL 4 +

Yes Test Studio supports Silverlight 4+

Does it support mobile platforms like Windows Phone, Android and iPhone

Test Studio supports IOS but as a separate product. Currently Test Studio do not support Windows Phone and Android

Can Test Studio Framework API can be used from MS TEST

Yes it can be used with MS Test.  You can find more details at

http://www.telerik.com/automated-testing-tools/support/documentation/user-guide/command-line-test-execution/mstest.aspx

http://www.telerik.com/automated-testing-tools/support/documentation/user-guide/write-tests-in-code/intermediate-topics/settings-and-configuration/settings-class.aspx

I hope you find this post useful. Thanks for reading.

Revamping Web Applications Part-1

Web applications have been around for quite some time. Generally, developers have been handed applications to enhance and extend with new functionality. This series of blog posts aims to showcase revamping/enhancing an existing web application.

image

The web application that we are going to select is a simple application that has been used for creating ad hoc social networks at events. The application enhances the utility of an in person event by providing opportunities of structured networking amongst attendees. The application presents a searchable directory of attendees. Sessions being conducted at the event are listed for delegates to build their personalised schedules. Once an attendee logs-in the application with the verified credentials he can communicate with other attendees and setup meetings with them. The organisers can benefit by making last minute changes to the sessions/ speakers at the event. Aspects of social gaming are included in the application to make it more interesting for the attendees.

Enhancements to the application can be categorized as follows:

  1. Improving User Experience
  2. Improving Functionality
  3. Improving Performance
  4. Multi-platform Support

The enhancements to the website will be done over 4 months in the following phases:

Phase 1:
Preparing a local working copy of the web application with connectivity to the database
Document the web application with the current features
Propose enhancements and secure sign off on the same

Phase 2:
Select Tools to use for enhancements
Document the performance of web application by:

  • Application Profiling
  • Performance Testing

It will be important to select the correct metrics for the web application

Phase 3:
Implementing the modifications proposed in the previous phases

  1. Upgrading to RadListView
  2. Converting GridView to RadGrid
  3. Working With RadWindow
  4. Implement RadScheduler
  5. Implement RadAutoCompleteBox

Make sure that modifications don’t introduce new bugs in the applications

Phase 4:
Run test suites and remove bugs if any
Document the performance of the enhanced web application by:

  • Application Profiling
  • Performance Testing

Highlight the changes in the selected metrics.

By using this application, the attendees benefit from interacting with targeted audience and building their professional circle more effectively.

Conclusion

In this post we have seen objective of the application and in next part we will discuss the possible enhancements and new features which can be added.

Read – Revamping Web Applications Part-2 Features

Three steps of working with JavaScript Array and Kendo UI Mobile ListView

In this post we will learn working with JavaScript array and KendoUI Mobile ListView in three simple steps.

Step 1: Create Data Source

Very first you need to create data source. Application can read data from various sources. Some of the source can be as following

  • Reading data from remote data source
  • Reading data from local memory
  • Reading static data from local array.

Let us create a data source by reading data from local array.


var speakers = [
{

SpeakerName: "Chris Sells",
SpeakerTitle: "Author, Ex- Microsoft and ardent community contributor",
SpeakerPhoto: "speakerimages/cs.jpg"

},
{

SpeakerName: "Steve Smith",
SpeakerTitle: "Speaker, Author, Microsoft Regional Director and MVP",
SpeakerPhoto: "speakerimages/ss.JPG"

},
{

SpeakerName: "Dr.Michelle Smith",
SpeakerTitle: "Enterprise Consultant",
SpeakerPhoto: "speakerimages/ms.jpg"

},
{

SpeakerName: "Gaurav Mantri",
SpeakerTitle: "Founder Cerebrata & Windows Azure MVP",
SpeakerPhoto: "speakerimages/gm.JPG"

}

];

Step 2: Create Template

Template is the way to tell the platform the way you want to display data. You already have data and next you need to decide the way you want to display or render data. In Kendo UI Mobile you can create template as following,


<script type= "text/x-kendo-template" id="speakersTemplate">
<div>
<img src=#=SpeakerPhoto# alt="#= SpeakerName #" />
#= SpeakerName #</br>
<span>
#=SpeakerTitle#
</span>
</div>
</script>

To create Kendo Template, You need to create a script with type text/x-kendo-template. Values from data source will be rendered by putting property name as following

image

In above case source of an image can be set as following. SpeakerPhoto and SpeakerName are properties of data array.

image

To make data rendering more immersive you need to set the style of data in CSS. You will notice in above template that we are setting class attribute of img and span tag. These classes are defines in CSS as following,


.pullImage {
width: 64px;
height: 64px;
border-radius: 3px;
float: left;
margin-right: 10px;
}

.listTime
{
font-size: .8em;
font-weight: 100;
}

Step 3: Create ListView

By step 2 you have created data source and template. Next you need to create ListView. Creating ListView is very simple and can be created as following,


<div data-role="view" id="dataview" data-title="Data">

<div>
<ul id="speakerslist"
data-template="speakersTemplate"
data-source="speakers"
data-endlessScroll="true"
data-role="listview"
data-style="inset">
</ul>
</div>

</div>

To create ListView you need to set data-role attribute of <ul> element as listview. To define how data should be displayed in the ListView set data-template attribute and data source can defined by setting data-source attribute.

Note: if we have put speaker’s photos locally in spakerimages folder. Since we are setting speaker photo attribute in Speaker JavaScript array.

Running the Application

On running of the application you should get ListView with speaker’s details as following

image

In this way you can work with data from JavaScript array and Kendo UI mobile ListView. I hope you find this post useful. Thanks for reading.

Telerik India wishes you happy New Year 2013

Telerik India wishes you very happy New Year 2013. We hope you will have healthy , happy and successful year ahead.

image

We are determined to help you in “Delivering more than Expected “. You will find us around all the community events and conferences in India.

We will create more blog posts and deliver 2 webinars each month in India time zone to expedite your learning and knowledge on various Telerik Products.

Once again we wish you joyful New Year. Let us work together in this year to “Deliver More Than Expected

How to work with Pie Charts in JavaScript based Application for Windows 8

In this post we will take a look on working with Pie Charts in JavaScript based Application for Windows Store. We will follow step by step approach in this blog post.

Step 1: Add References

Very first we will add Telerik JS and CSS files references in the project. If first time you are working with Rad Controls in Windows 8, I suggest you to read blog post to setup the environment

After adding the files in the project we need to refer them on the html file . Files can be referred as given in following code snippet.

<!--Telerik References -->
 <script src="/Telerik.UI/js/jquery.js"></script>
 <script src="/Telerik.UI/js/ui.js"></script>
 <link href="/Telerik.UI/css/dark.css" rel="stylesheet" />
 <link href="/Telerik.UI/css/common.css" rel="stylesheet" />

Step 2: Create a Chart

A Pie chart can be created by setting data-win-control attribute of a div as Telerik.UI.RadChart and setting series type as pie


<div id="performancechart" data-win-control="Telerik.UI.RadChart"
 data-win-options="{
 series: [{
 type: 'pie',
 data : [

{value:30,category:'Math'},
 {value:20,category:'Physics'},
 {value:22,category:'Chemistry'},
 {value:28,category:'Economics'}

 ],
 lables :
 {
 visible:true
 }

 }
 ]}"

 />

&nbsp;

In above code snippet,

  • We are setting data-win-control attribute as Telerik.UI.RadChart
  • In data-win-options , series type is set as pie
  • In data-win-options data is set locally.
  • Data array contains two properties. They are values and categories

At this point if we go ahead and run the application, we will get an output something like below

image

Step 3: Configure More Pie Chart options

You can configure common options of char series as discussed in this blog post . Apart from common options you can configure options like following,

  1. colorField
  2. explodeField
  3. categoryFiled

Assume you have data source as following

image

You can configure these values for pie chart as following

image

On running you will pie chart as following. You will find that colours of categories have been changed.

image

You can explode a category as following. Even though in following example we are setting explode attribute with explode property in data array, you are free to set any property of data array as explode field by setting explodeField attribute as we set colorField.

image

On running you will pie chart as following.

image

In this we can work with pie charts. Below is the consolidated code of above discussion


<!DOCTYPE html>
<html>
<head>
 <meta charset="utf-8" />
 <title>TestDemoJavaScript</title>

<!-- WinJS references -->
 <link href="//Microsoft.WinJS.1.0/css/ui-dark.css" rel="stylesheet" />
 <script src="//Microsoft.WinJS.1.0/js/base.js"></script>
 <script src="//Microsoft.WinJS.1.0/js/ui.js"></script>

<!--Telerik References -->
 <script src="/Telerik.UI/js/jquery.js"></script>
 <script src="/Telerik.UI/js/ui.js"></script>
 <link href="/Telerik.UI/css/dark.css" rel="stylesheet" />
 <link href="/Telerik.UI/css/common.css" rel="stylesheet" />

 <!-- TestDemoJavaScript references -->
 <link href="/css/default.css" rel="stylesheet" />
 <script src="/js/default.js"></script>
</head>
<body>

 <h1>Chart Demo</h1>

<div id="performancechart" data-win-control="Telerik.UI.RadChart"
 data-win-options="{
 series: [{
 type: 'pie',
 data : [

{value:30,subject:'Math',color :'red',exlode : 'true'},
 {value:20,subject:'Physics',color:'blue',explode:'false'},
 {value:22,subject:'Chemistry',color:'green',explode:'true'},
 {value:28,subject:'Economics',color:'gray',explode:'true'}

 ],
 field: 'value',
 categoryField: 'subject',
 colorField :'color',
 lables :
 {
 visible:true
 },
 tooltip :
 {
 visible : true
 }

 }
 ]}"

 />

&nbsp;

</body>
</html>

&nbsp;

Future Post

In this post we learnt working with pie Charts. We focused on only one type of series. In further posts we will explore various series type and working with remote data in the Rad Chart. I hope you find this post useful. Thanks for reading.

How to set background image of Kendo UI Mobile View

In this post we will take a look on how to set background image of Kendo UI Mobile view. Let us say we have a view as following,

image

This Kendo UI Mobile View is created as following,


<div data-role="view" id="tabstrip-home" data-title="Hello World!">
<h1>Welcome!</h1>
<p>
This is View
</p>
</div>

Now you have a requirement to put a background image in this view and set the colors of the texts on the view. You can do it by setting style of div in the CSS. This can be done as following


#tabstrip-home .km-content{

background-image: url('../appimages/backgroundimage.jpg');
background-size: auto 100%;
background-repeat: repeat;
color : white;

}

In above code snippet ,

  1. Tabstrip-home is id of the view. Background image of this particular view will be set to an image.
  2. Background image is inside the folder appimages. We are setting backgroundimage.jpg as the background of the view.
  3. Image will repeat itself as background of the view.
  4. Text of the view content has been set to white.

After setting style view should look like as following image,

image

In this way you can set an image as background of KendoUI Mobile View. I hope you find this post useful. Thanks for reading.

Create APK package for Google Play using Icenium Graphite

In this post we will take a look on creating APK package for submission to Google Play using Icenium. Let us follow following walkthrough to create APK package,

To create package, Right click on the project and select Publish to create APK package,

clip_image001

In the next window click on Google Play. You will get an error message that there is no certificate or Code Sign Identity found for Google Play Signing.

image

To solve this issue click on the option in Icenium Graphite IDE.

image

In Users Option window select General tab and then Certificate Management option.

image

In Certificate Management option you will get an option to create New Certificate. Click on Create New to create new certificate. You can either use

  1. Self-signed identity
  2. Request for the Certificate

Let us go ahead and request for the Self-signed identity. In Self-signed identity window you need to provide following vital information,

  • Country
  • Type of the self-signed identity. In this choose Google Play as option. Other option available is Generic.
  • Configure Start Date and End Date

image

After creating Self-signed identity you can find them in Cryptographic Identities section. Below you can see that I have created three self-signed identity.

image

After creating Self-signed identity right click on the project and select properties in the properties windows, select Android tab. Here you can set various application properties for android platform.

image

From the Code Signing Identity drop down, select any existing certificate to associate it with the application.

image

You can set icons, application permissions for Google Play here. After associating self-signed identity again right click on the project and select publish option. You will get Application Validation Status message as OK.

image

Next click on the Build button to create the package. Icenuim will build the application in cloud and ask you to give a name of the apk package and save it locally.

image

In this case we saved APK with name tearchapp. Now you can submit the APK file to Google Play to publish application. I hope you find this post useful. Thanks for reading.

Make a Call on Icenium using PhoneGap

In this post we will take a look on making a call using PhoneGap in a Hybrid application creating using Icenium. Let us create a view like following to make a call,

image

Above view can be created using following code snippet,


<div data-role="view" id="callview" data-title="Make a Call">
<h1>Call this number!</h1>
<div id='Div1'>
<label for="txtName" style="display: inline-block;">Enter Phone Number to Call:</label>
<input type="text" id="Text1" value="" />
</div>
<div>
<a id="A1" data-role="button" data-click="callfunction" data-icon="action">Make A Call</a>
</div>
</div>

On click of Make a Call button a call can be done as following,


function callfunction() {

var phntocall = document.getElementById('txtPhoneNumber1').value;
window.location.href = "tel:" + phntocall;

}

In above code snippet we are reading phone number. After that using tel: to make a call. It will open native Call application with configured phone number to make a call.

I hope you find this post useful. Thanks for reading.

How to fetch data of selected item in KendoUI Mobile ListView

In this post we will take a look on how to read data value of selected item in KendoUI Mobile ListView. Let us say you have a ListView as given in following image,

image

As you see that there is button in each ListView item and on click of the button you need to fetch the selected phone number to make a call.

Above ListView can be created as following,


<div data-role="view" id="policestationview">

<ul data-role="listview"
id="policestationlistview"
data-style="inset"
selectable="true"
data-source="somedata"
data-template="sometemplate"
data-click="somefunction">
</ul>

</div>

In above view

  • Data source is set to somedata
  • Data Template is set to sometemplate
  • Most importantly data-click is set to a JavaScript function

Now in function you can fetch selected item on click event of ListView as following,

image

In above code snippet phonenumber and name is properties of the array set as the data source of the listview. For your reference datasource is as following. You can see that name and phonenumber are properties of the array used to create datasource.


var dataarray = [

{ name: "Darya Ganj", phonenumber: " 01123274683", group: "CENTRAL" },
{ name: "Kamla Mkt", phonenumber: "01123233743", group: "CENTRAL" },
{ name: "I.P. Estate", phonenumber: "01123318474", group: "WEST" }

];

var somedatasource = new kendo.data.DataSource.create(
{
data: dataarray,
group: "group"
});

</script>

In this way you can fetch data of slecetd itm of KendoUI Mobile ListView. I hope you find this post useful. Thanks for reading.